
Elliott Waves Theory: Identifying Tops and Bottoms
The Elliott Waves Theory uses cycles of various degrees to explain market moves. Having an impulsive and corrective part, an Elliott cycle illustrates the close relationship between pessimism and optimism in Forex trading.
Bullish investors tend to build up a position by adding to longs in an uptrend. But they also fight bearish moves by trying to identify the bottoms.
The same is valid for bearish investors, as they’ll fight a bullish trend by trying to pick tops all the time. Forex trading is full of reversal patterns, with the Japanese candlesticks being the preferred ones due to their simplicity and robust results.
But the Elliott Waves Theory also provides areas where the market might turn. The keyword here is “areas,” and not a specific level.
Waves of Same Degrees to Pick Tops and Bottoms
The first thing that strikes the eye when trading with the Elliott Waves Theory is the number of rules to follow. The market needs to do this, then that, and so on.
When making a forecast, if the market fails to respect a single rule, it is enough to ruin the entire count.
But that’s only the worse case scenario. The best case scenario and the reason why traders pile in to learn the dips of this trading theory comes from its accuracy.
While following all the Elliott rules in Forex trading may be painful, the potential reward more than covers for the effort.
Picking tops and bottoms is the fata morgana of Forex trading. Everyone believes they found a solution, only to see the market coming for their stops.
Picking tops and bottoms is never easy. It is a risky approach to Forex trading, and if any trading theory is able to predict it correctly, it’s the Elliott theory.
One way to go is to interpret the b-wave in any corrective phase. But the key here is that what’s about to follow in this article doesn’t refer to all the b-waves possible to form, but only to some.
Namely, to the b-waves that follow after the first a-wave in a correction. Either a simple or complex correction, the focus is on the first b-wave.
In a simple correction like a zigzag, flat or triangle, that’s easy to interpret as there is only one b-wave. The trick is to “remember” to ignore the second or the third b-wave in a complex correction.
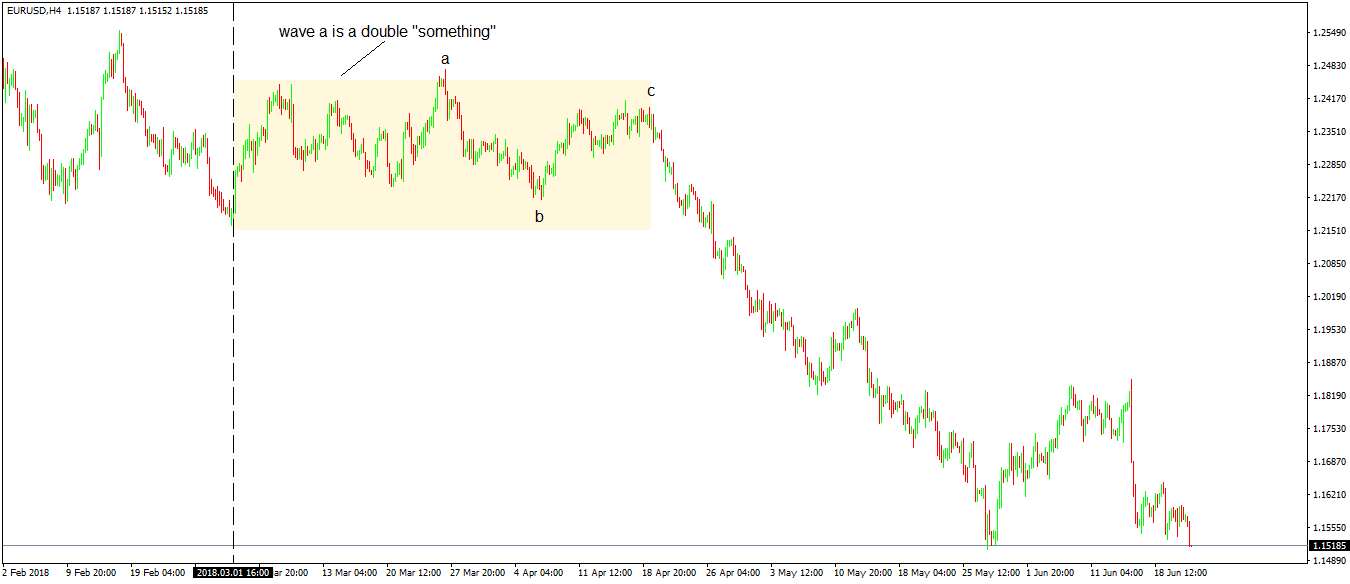
When Wave A is a Double “Something”
Everything depends on what the a-wave structure is. If it is a double combination, flat, or zigzag, it means it is a corrective wave.
If the a-wave is corrective, it means the wave of a bigger degree is corrective too. Hence, the b-wave that follows can only be the b-wave of a flat or triangle.
It doesn’t really matter if the corrections of a more significant degree are simple or complex. Remember, the key is to focus on the first b-wave in the structure.
One of the most powerful rules in the Elliott Theory tells that in this case, the b-wave can retrace maximum 80% of the a-wave’s length. There you go, the potential bottom or top in any related trade.
The more the market approaches the level, the more aggressive the Elliott traders would become.
A tricky thing here is to find out the 80% retracement level. The problem is that it doesn’t form by measuring the a-wave from top to bottom. Instead, by measuring it from its start to its end. In many cases, it results in a different level.
When Wave A is a Triple Something
When wave a is a triple combination, triple flat or even a triple zigzag, the b-wave has an even harder time to retrace. Typically, it won’t go beyond the 70% retracement level, and most of the times it goes between 61.8% and 70% retracement when compared with the previous a-wave.
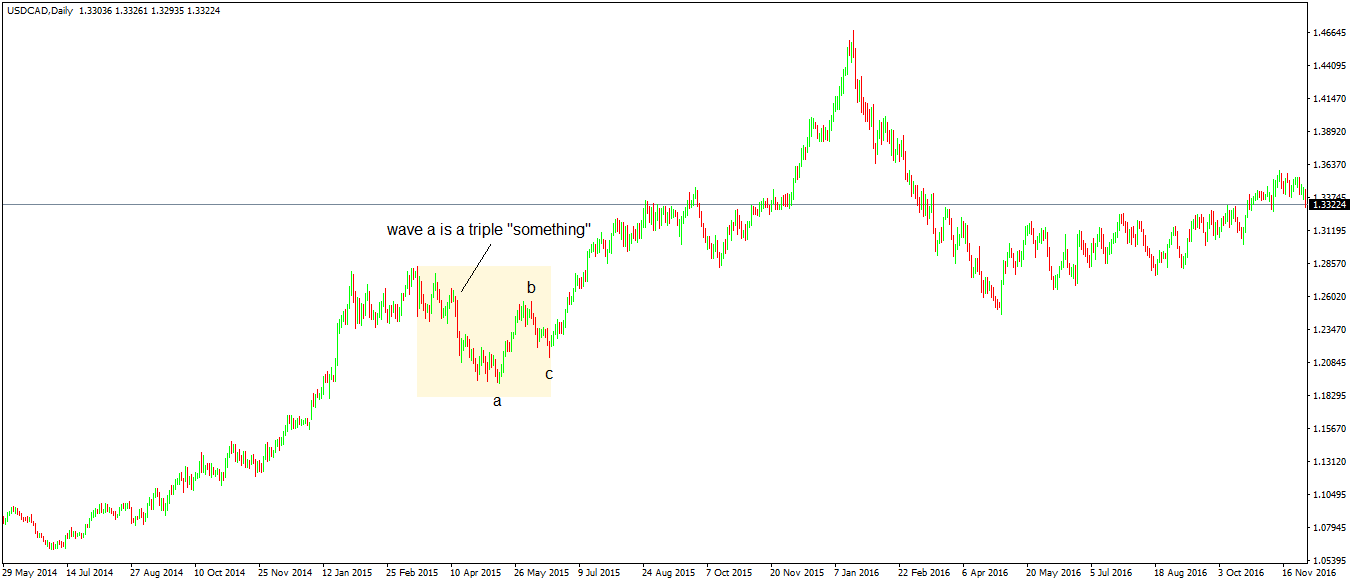
There you go, an area with the minimum and maximum distance where the price must go. Or, a potential top or a bottom, depending on the direction of the underlying trend.
Failures with the Elliott Theory
The name refers to flat patterns that have at least one failure. By studying failures, Elliott identified patterns that show a countertrend strength.
Moreover, the concept refers to the:
- b-wave of a flat
- c-wave of a flat
- both
When the B-Wave Fails
The inability of the b-wave to retrace more than 80% of the previous a-wave is called a flat with a b-failure. While the c-wave may completely retrace the entire b-wave, this is just a temporary bounce as the more significant degree trend will prevail.
When the C-Wave Fails
This setup often appears in Forex trading. The failure, in this case, refers to the inability of the c-wave to fully retrace the previous wave b.
It is a powerful setup for a top or bottom as the market typically forms a reversal pattern: most commonly a rising or falling wedge.
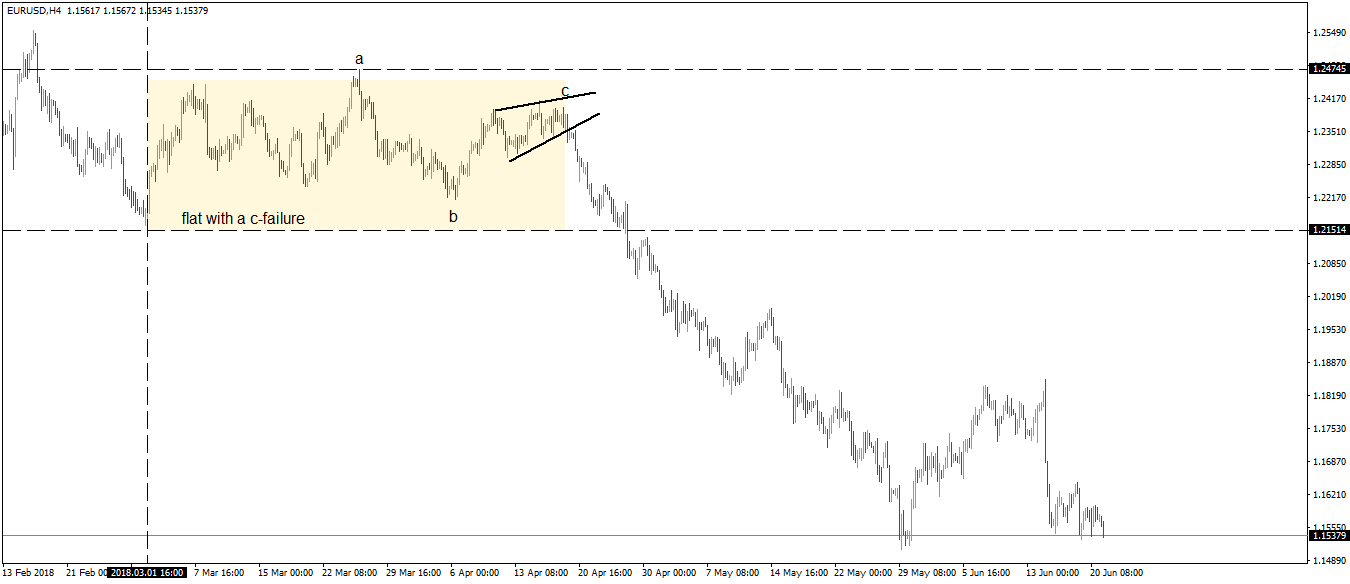
Above is the recent EURUSD price action. It started a downtrend in the second quarter of 2018, ignited by a flat with a c-failure.
The conditions for it are obvious:
- the b-wave retraces between 80% and 100% into the wave’s a territory
- the c-wave fails to retrace all of the b-wave
- in doing that, it forms a rising wedge
We can say that the rising wedge was a bearish sign coming to complete a “by-the-book” Elliott wave flat with a c-failure pattern. Remember that a failure signals a countertrend strength and the EURUSD bearish move that followed more than proves it.
Double Failures
A double failure refers to the common situation when both the b-wave and the c-wave fail. The first one fails to retrace beyond 80% of wave a, while the second one fails to retrace the previous b-wave completely.
It generates a tremendous countertrend reaction, with the price action tripping stops fast and furious.
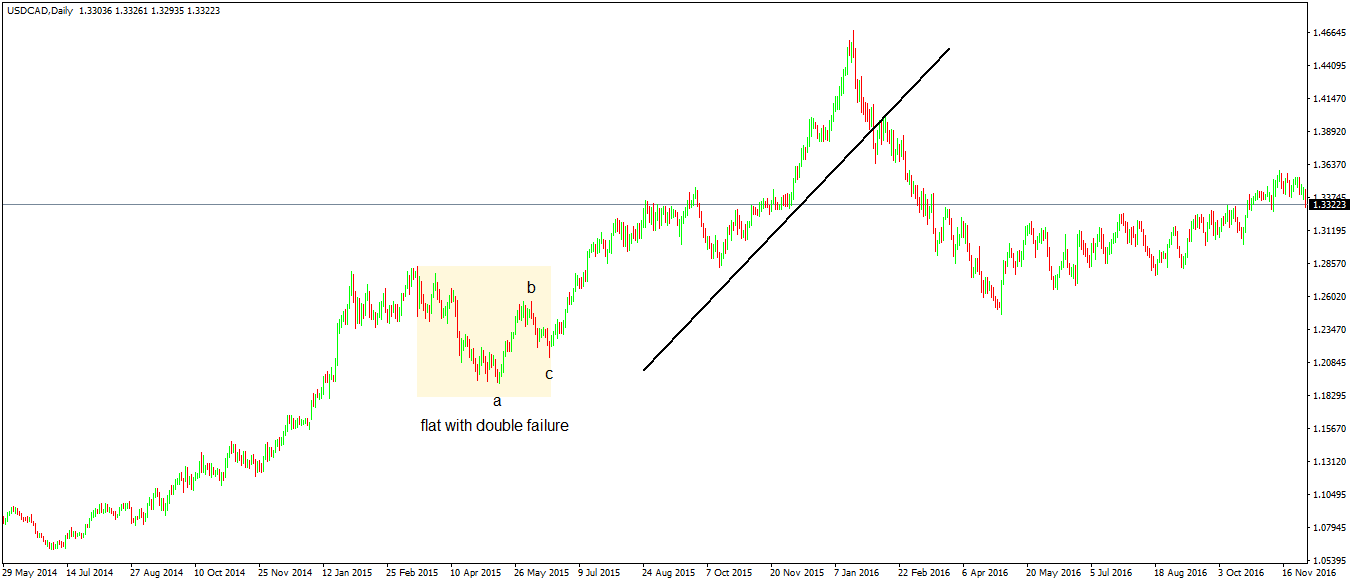
This is the USDCAD showing the potential of a flat with a double failure. It shows a bottom on the lower timeframes, one that ended that was followed by a tremendous break higher, signaling the countertrend strength of a pattern with a failure.
Conclusion
The ability to pick tops and bottoms with the Elliott Waves Theory comes at the end of a reasoning process. Traders use logic and a distinctive set of rules to connect the dots in the theory.
When right, the results are amazing. Either bottoms or tops of a temporary correction, or ones that end a stronger trend, Elliott set the rules for finding them both.
Trading tops and bottoms means going against the trend and the conventional wisdom. Typically, the market trades in the other direction, for quite some time, and patience is put to the test.
Nevertheless, traders will quickly get over it as the market confirms the pattern, and, implicitly, the Elliott count.