
How to Trade the Thrust of Different Triangles
Triangles are the most common technical patterns forming in Forex trading. Whenever you think of a potential consolidation area, the first thing that comes to mind is a triangle.
Because volatility is high in Forex trading, patterns tend to be distorted. Most of technical analysis pattern recognition was documented way before the currency market existed. The United States stock market was the only one available for traders to interpret and forecast future prices derived from a chart.
What matters though is the ability of a trader to “see” the patterns. While they may be distorted, trading them respects the same principles as when they were documented.
Take the ascending and descending triangles for example. The original rules say that they revolve against a horizontal line.
It may be still true in the stock market, but in Forex trading such triangles rarely appear anymore. This is a market where most currency pairs have five-digit quotation and finding the same level for a base of an ascending or descending triangle is difficult.
Instead, Forex traders are flexible. Such triangles do form, but instead of a level, traders interpret an area.
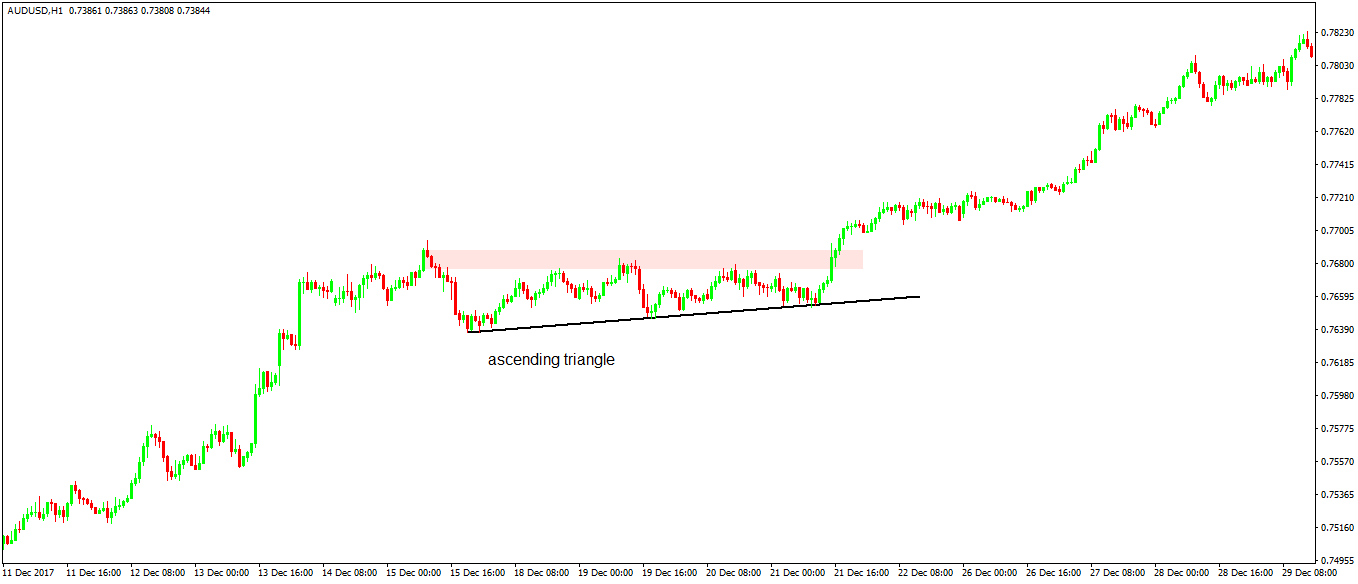
The chart above shows an ascending triangle in today’s Forex trading. It formed on the hourly chart on the AUDUSD pair, and it shows the market building pressure against a level until, eventually, the level gave way.
The reason for posting the example above is to illustrate the nature of a triangle. It builds pressure, and the first thing to look for is a series of higher lows in this case. While the price action tries to break the pink area, the dips form a series o higher lows suggesting the market will form a triangle.
During the triangle’s formation, it isn’t clear what type of a triangle will end up on the chart. However, regardless of the triangle’s type, they all have one thing in common: the thrust.
Explaining the Thrust of a Triangle
While the name sounds fancy, the thrust of a triangle is merely its measured move. Many technical analysis patterns have a measured move (e.g., double tops and bottoms, the head and shoulders pattern, etc.), so why not a triangle too?
Trading the Thrust of an Ascending or Descending Triangle
Because there are so many types of triangles, the thrust differs with each triangle. The ascending triangle illustrated above falls into the category of horizontal triangles.
Generally speaking, the thrust of a triangle like the one below is one hundred percent of its most extended segment. Because of the ascending nature of it, this is typically the first segment in the triangular formation.
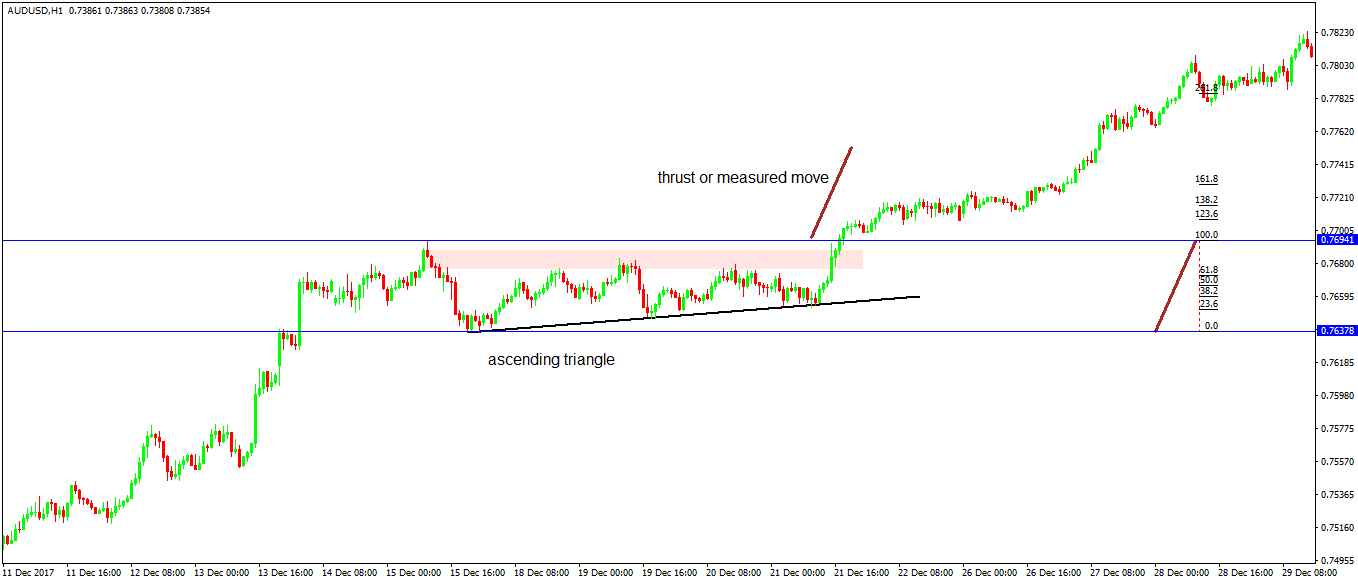
The steps to determine its thrust are:
- Use two horizontal lines to measure the longest segment
- Project the thrust from the maxim point
- That’s the minimum distance for the price to travel as it confirms the triangular formation
While it doesn’t result in a great risk-reward ratio, traders consider the nature of the triangle and its implications when exiting. Hence, as the triangle is a continuation pattern, savvy traders:
- go long on a break higher
- set the stop at the last higher low swing
- book half the profit at the measured move
- raise the stop loss to break-even
- target 1:3 ratio for the rest or trail the stop further.
Trading the Thrust of a Horizontal Triangle
Ralph Elliott was the first one to put “order” in triangles. He suggested that labeling them with letters will result in a better understanding of the price action both during the triangle’s formation as well as after the price breaks.
Horizontal triangles are the ones that appear on all charts. Every trader is familiar with horizontal triangles, as they contract all the way to a point where the price breaks higher or lower.
But horizontal triangles aren’t that powerful as ascending or descending triangles. The explanation comes from the fact that they can be both continuation and reversal patterns.
In the case of ascending or descending triangles, the interpretation is crystal clear, as they are only continuation patterns.
For this reason, the thrust of a horizontal triangle is not one hundred percent of the longest segment, but only three-quarters of it. Or, seventy-five percent.
Horizontal tringles are of two types:
- - symmetrical contracting triangle
- - irregular contracting triangle
They both have the same measured move or thrust: seventy-five percent of the longest segment. However, the difference is that the longest segment differs. To illustrate that, we’ll use the a-b-c-d-e labeling of a triangle as Elliott suggested.
In a symmetrical contracting triangle, every leg is smaller than the previous one: a>b>c>d>e. Hence, the thrust applies to the a-wave, as the longest segment.
However, in an irregular triangle, the b-wave is the longest. Hence, ac>d>e. The irregularity coming from the b-wave tells us that the thrust of an irregular contracting triangle applies to the b-wave.
As mentioned earlier, triangles like these appear both as continuation and reversal patterns. The recent EURUSD price action is suggestive: it failed at the 1.25 area in the first quarter or 2018, forming an irregular contracting triangle.
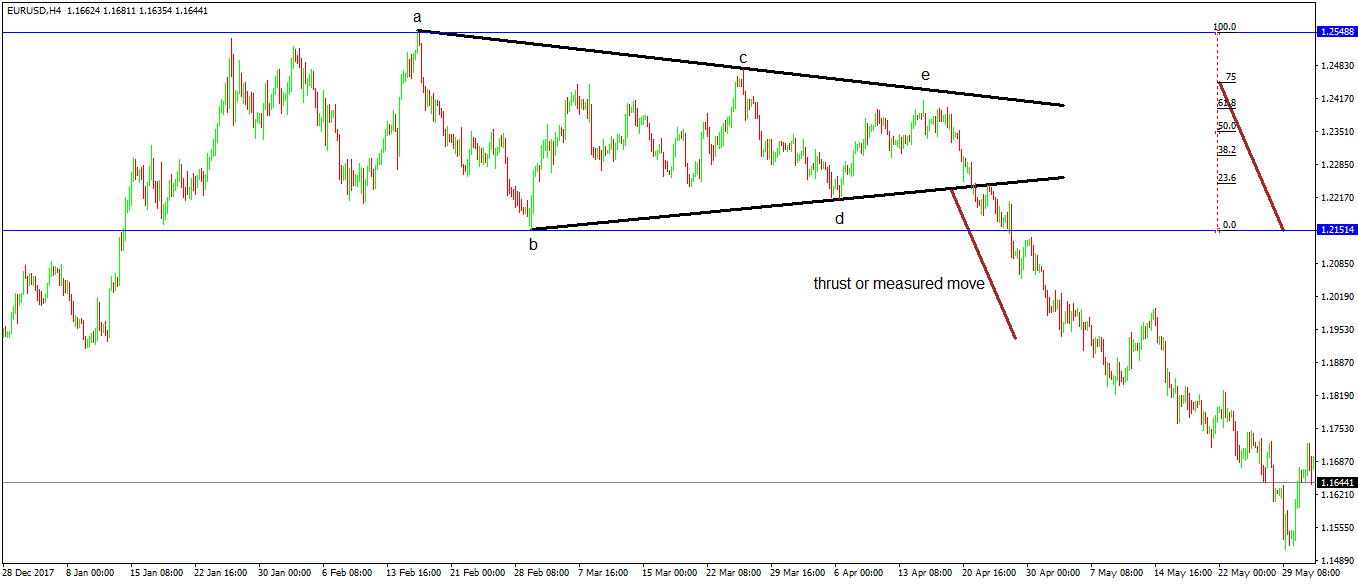
To find out the longest segment, merely use two horizontal lines to delimitate the length. Next, take 75% of the b-wave to find out the thrust. Finally, project the thrust from the b-d trendline’s break, and not from the lowest point of the triangular formation.
Typically, the price retests such triangles. Hence, traders wait for the b-d trendline to break, and to be retested. They use this retest for the entry as it confirms the b-d trendline is in place.
But again, the measured move only comes to confirm the triangular formation. When Forex trading with the Elliott Waves Theory, this is important because the triangle’s presence suggests what the new pattern will be.
For instance, a triangle that acts as a reversal pattern like the one above did can only form at the end of a complex correction (e.g., double combination or triple combination) or at the end of a terminal impulsive wave. Hence, the move to follow must relate with the entire previous leg, and Elliott established the rules and probabilities for what the market forms.
In this case, the move lower was violent. In less than a trading month, the EURUSD pair lost over a thousand pips. Since then, it consolidates, but the triangle at the end of the previous bullish trend did quite a job as a reversal pattern.
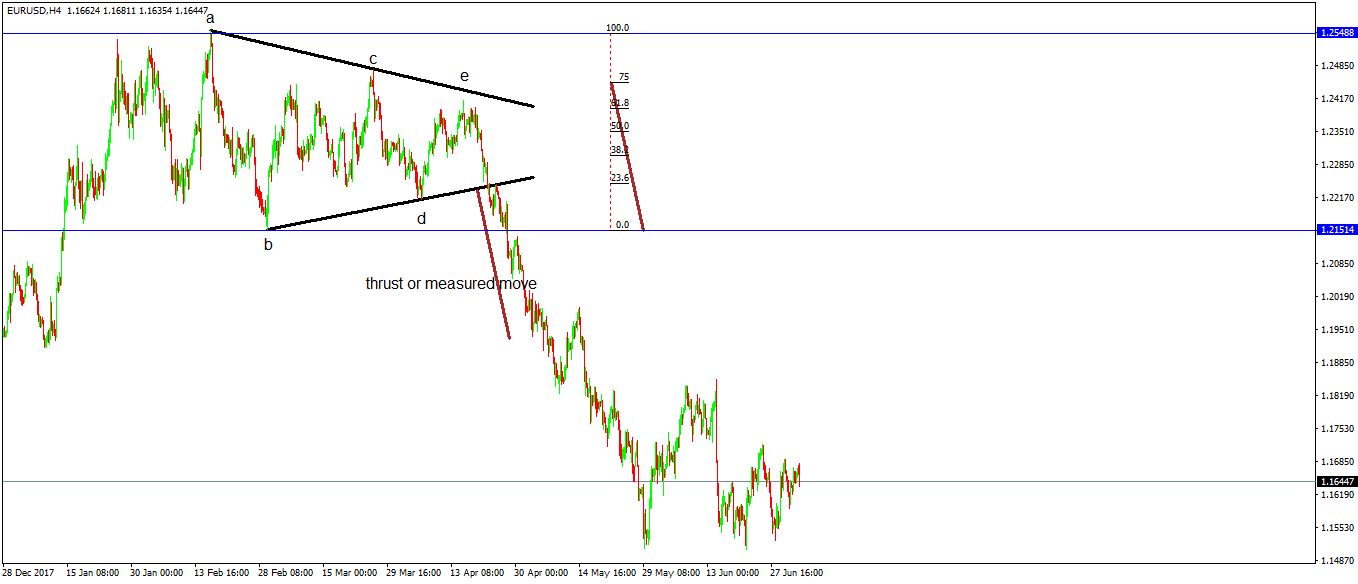
As you can see, the measured move is symbolic when compared with the length of the new trend. However, traders use trailing stops and book half profits when the price reaches the measured move and trail the stop for the rest of the position to make the most of the new trend.
Conclusion
The thrust of a triangle only comes to confirm it. It represents the minimum distance the price MUST travel.
If the price is unable to reach the designated thrust, traders discount the triangle.
The Elliott Waves Theory covers other types of triangles like the running variation of a contracting triangle. Such triangular formations don’t form on the horizontal and has the thrust exceeding 161.8% of the triangle’s longest segment.
However, these are rare patterns. So rare, that in Forex trading they almost never appear.