
Time and Its Valuation in Forex Trading
The primary focus of Forex trading is the price. More precisely, where the price goes.
After all, this is what the traders must answer: will the price move to the upside or the downside?
To have an educated guess (because no one knows for sure), traders use technical and fundamental principles. Forex trading represents taking a long or short position as a result of a technical and fundamental analysis.
But have you wondered if this is enough? Is it ok to only focus on price?
The answer is that yes, it is alright, but something is still missing. Time.
Price and time is where the savvy traders’ focus lies. If one can set a time target to a price target, trading becomes easier, costs are avoided, and everything becomes more evident.
Price and time. The holy grail in Forex trading, the perfect forecast that not only tells where the price goes but when!
The Holy Grail in Forex Trading
Here’s how a price and time forecast in Forex trading should sound:
- - going long or short at a specific level, with a stop loss and a take profit dependent on both price and time.
Namely, the price MUST reach a certain level in a specific period. By time, note that we don’t refer to an exact calendar day.
Instead, the time associated with Forex trading refers to the maximum period when the price MUST reach the target. If that doesn’t happen, traders just close the trade at the market.
Hence, the time element triggers the stop loss and conditions the take profit. In fact, it is the connecting link between the elements of a trade. Price and time, what a beautiful concept!
Believe it or not, there are many concepts in technical analysis that follow the price and time conditionality. The reason why retail traders do not use them is only that they don’t know how valuable time is to a forecast.
Price and Time in Triangular Formations
Triangles are the favorite way for markets to consolidate. They form on all the timeframes and are either continuation or reversal patterns.
Elliott Waves Theory was the first one to put an order to triangular formations. Until Elliott, all technical traders knew were the ascending and descending triangles.
However, Elliott noticed that not all patterns that resemble a triangle are, in fact, triangles. Hence, he put a time condition just before the triangle’s break.
Before revealing it, let’s remember what a triangle is according to the Elliott Waves Theory:
- - a triangle is a simple corrective pattern
- - traders use letters to shows the five legs of the triangle: a-b-c-d-e
- - a triangle evolves between the b-d and a-c trendlines
- - the b-d trendline is the most relevant one as it shows the end of the triangular formation
As mentioned earlier, the time rule refers to the last leg of the triangle. Namely, the e-wave.
The rule goes like this:
- - the price MUST break the b-d trendline in less or the same time it took wave e to form
If this simple rule isn’t respected, the market didn’t form a triangle.
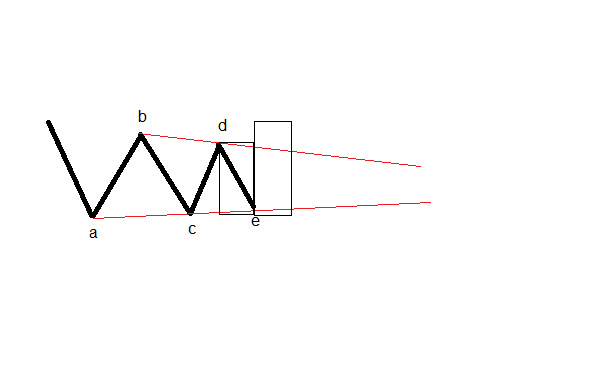
The image above shows a triangle as envisioned by Elliott. The b-d and a-c trendlines marked with red tell us the contracting nature of it.
As explained, the focus sits with the b-d trendline. For the price to validate the triangle, it MUST break it in less than the e-wave’s time.
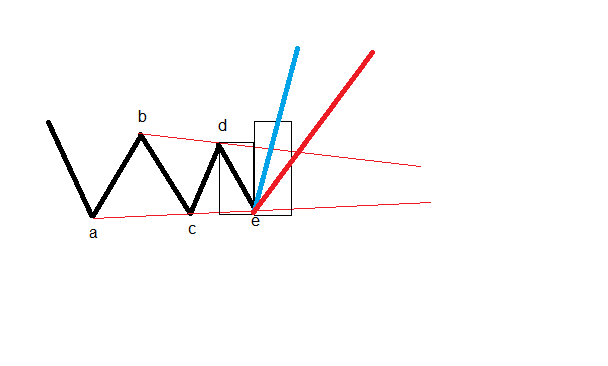
The blue and the red lines show the correct and the incorrect price and time relationship in a triangular formation. The blue line shows the correct break.
What traders do is the following:
- - use a shape or any other way to measure the time taken for the e-wave
- - project the resulting time on the right side immediately after the e-wave’s end
- - stay on the long side until the price reaches the b-d trendline in the due time.
However, it may be that the triangle isn’t completed. More precisely, the e-wave may not be done.
Hence, traders use the time element to get out of the trade. For instance, in most triangles, the e-wave tends to pierce the a-c trendline.
Aggressive traders use this moment to enter a trade. But they know that the price must reach the b-d trendline in less than the time taken for the e-wave to form.
Therefore, if time passes and is about to expire before reaching the target, traders just close the trade as the e-wave isn’t completed. Even in this case, the trade ends up with a profit, but the trigger to exit the trade wasn’t price, but time.
Confirmation For Simple Corrections
One of the biggest problems with the Elliott Waves Theory comes from the distinction between simple and complex corrections. Elliott found that complex corrections appear more often, and that is especially true in Forex trading.
But how do traders know when the x-wave forms? When to expect it?
The answer comes, again, from the time element. In a flat or a zigzag, the price must retrace the c-wave in less or equal time it took to form.
If it does, the a-b-c is simple. If not, the market forms a complex correction, and the x-wave appears.
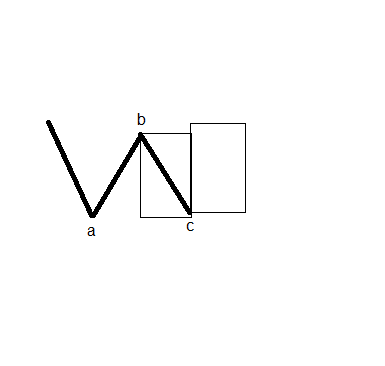
The image above shows a flat pattern. Because the b-wave retraces so deep into the territory of the previous a-wave, traders interpret it as a flat pattern.
However, the main problem is to forecast what comes next. Is this a-b-c a simple correction? Or will the market end up forming a complex one?
Once again, the time element comes to help.
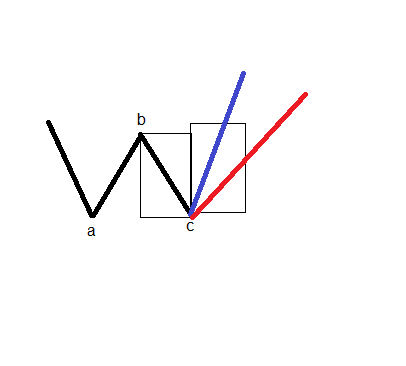
In the blue scenario, the price retraces the c-wave in less than its time. Hence, the a-b-c is a simple flat, so it concludes a wave of a bigger degree.
The red scenario, though, shows the price breaking higher too. However, it does that without respecting the time rule. Hence, it tells traders that the a-b-c is not a simple correction. Instead, the market will form a complex correction, and the red move shown above is just the first part of an intervening x-wave.
Conclusion
As you probably guessed by now, this article is all about the Elliott Waves Theory. It comes to complete all the previous Elliott concepts described in this Trading Academy.
There’s also a rule of equality in impulsive waves that tells traders if the impulsive wave is valid or not. Namely, the time taken for the fifth and first waves in an impulsive wave must be equal or relate to the golden ratio (61.8%).
Elliott wasn’t the only one to use the price and time in trading. W.H. Gann was famous as he predicted not only the price level of certain stocks but also an approximate moment when it will reach it.
Gann used astrology a lot and believed in the power of planetary moves and their effects on human nature. Unfortunately, Gann’s way of projecting the time for a trade died with him, and everything in his technical analysis legacy is filled with mystery.
To sum up, price and time should follow every trade. Unfortunately, the situations when traders can use them both aren’t that common in Forex trading.
Because the Elliott Waves Theory provides most of them, this is where the focus was. However, some classic technical analysis patterns like the falling and rising wedges, or even the head and shoulders pattern, have a time component too. But more about that, perhaps in future articles.