

The Most Popular Trend Indicators: Standard Interpretation
The previous article in our Trading Academy dealt with what a trend is and what makes a trending market. For understanding the concept, we described how a series of lower highs and higher lows define it.
But traders have other tools to use too. All trading platforms give access now to all kinds of technical indicators, with the idea of helping traders find the right strategy.
Technical indicators come in two categories: trend indicators and oscillators. The standard interpretation is that trend indicators help to ride a trend, while oscillators show potential reversals.
Forex trading though, is not a straight line. In a rising trend or a bullish market, traders wait for the best entry place.
When doing that, they wait for a pullback before going long. Sometimes, however, that pullback isn’t just a pullback, but the start of a new trend. A bearish one.
For this reason, any strategy must have a risk management system designed to cover losses as quick as possible and let the winners run.
Trading software these days plot the trend indicators on the main chart. That is the main difference between oscillators and trend indicators: where they appear on the chart.
However, with the use of personal computers, traders began to build their own trading systems. And, their indicators.
Because most of Forex brokers offer the MetaTrader4 platform to their clients, we’ll use it to discuss the standard interpretation of the most popular trend indicators. However, keep in mind that any platform allows to build and import a custom one too. More about this later in the Academy.
Favorite Trend Indicators and Their Use in Forex Trading
A trading platform offers many indicators and oscillators to use. However, they show the same thing.
To ride a trend, merely refer to the previous article. That’s all you need to know.
Sometimes, though, strategies require confirmation. For example, traders identify a trend, say, bullish, and then the next challenge is to find out the perfect entry place for a trade.
As such, they look for the entry, exit, and take profit. So, they need extra help.
The danger comes from the trading platform (software). It offers so many options to choose an indicator, that the chart becomes too crowded. After all, they all have the same purpose: to show the trend.
To avoid this, here’s a list of the most used trend indicators and their standard interpretation.
Moving Averages.
Most traders have used moving averages at least once in their career. The concept is simple: this indicator averages the closing price of the previous periods and plots a value at the current price level.
The bigger the period the moving average considers, the more powerful the implications are. Traders use multiple types of moving averages, depending on their Forex trading strategy.
For example, the simple form is the one described above. The name is suggestive: SMA (Simple Moving Average).
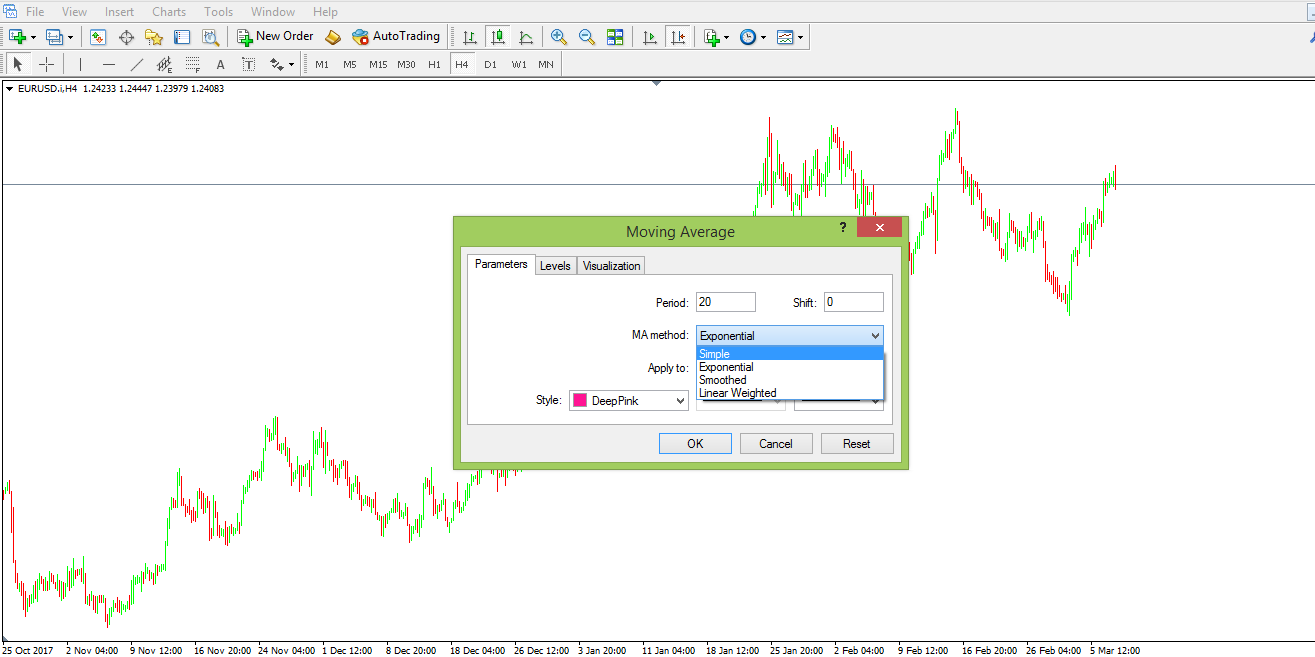
But that is only one option they have. First, go to the Insert tab in the main menu, and select the Indicators tab.
Second, choose the Trend Indicators option, and the Moving Average (MA). A window like the one above appears.
Finally, choose the desired settings. The period gives “weight” to the moving average: the bigger, the more important.
The type shows how the indicator calculates the average: simple, exponential, smoothed or linear weight.
And the platform allows choosing even the price to use: opening price or closing price. Typically, most strategies use the closing price of a period/candle.
The primary use of an MA is to split a market into bullish and bearish conditions. Or, into bullish and bearish trends.
The standard interpretation is that when the price evolves above the MA, a bullish trend exists, and traders want to go long.
On the other hand, a bearish market must have the price below the MA. Traders want to sell on spikes.
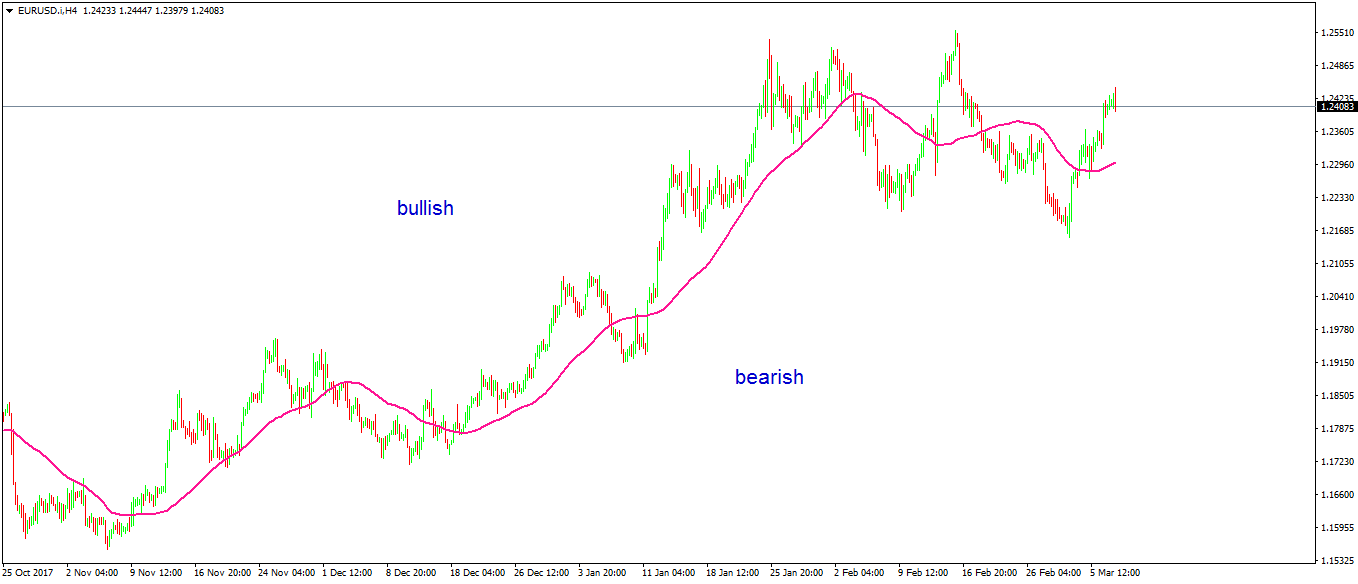
The chart above has the SMA (Simple Moving Average) with the 50 periods on it. That’s the four-hour chart on the EURUSD.
Effectively, it means the SMA (50) averages the closing prices of the last fifty candles, and plots the value. In this case, the price sits above the SMA (50).
According to the definition, the EURUSD is in a bullish market. Longs are recommended.
But only one MA on a chart leaves room for error. And, in any case, the 50 period is not that relevant.
In Forex trading and charting in general, the MA (200) is the mother of all MA’s. A bigger period will flatten the MA, so it looses its relevance. A smaller one leaves room for errors.
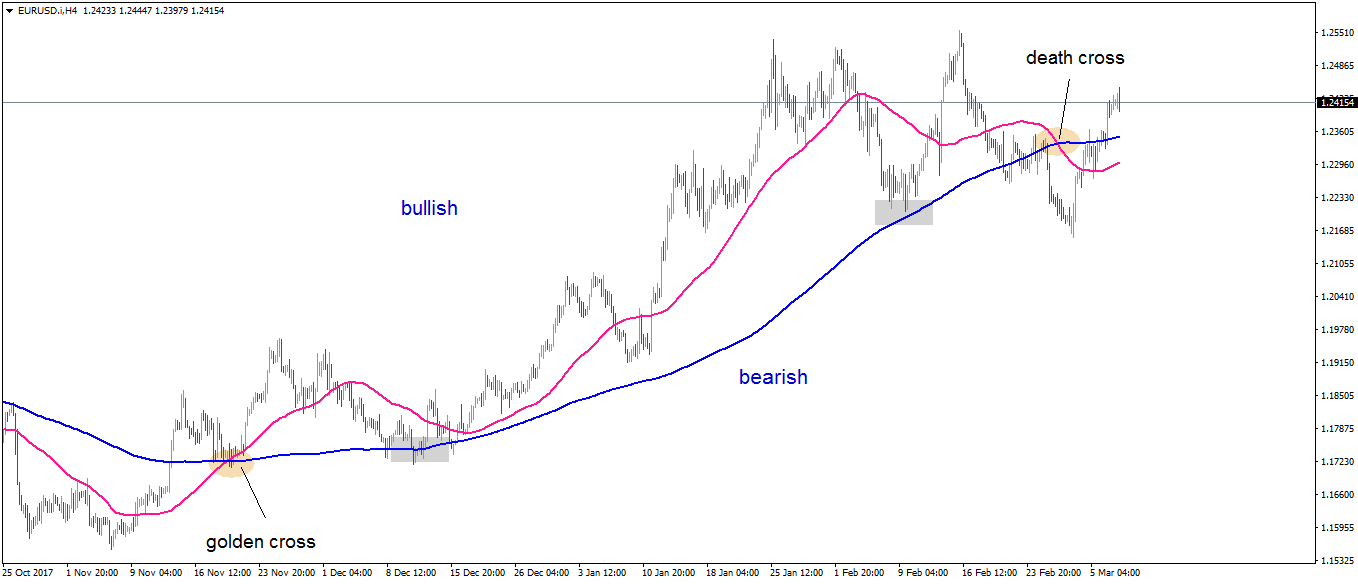
One of the most influential strategies is to use both SMA (200) and SMA (50) to ride a trend. When they cross, the market generates a buying or selling signal:
- Golden cross - the SMA (50) crosses above SMA (200). That’s a bullish signal; traders use the dips into SMA (200) to go long and ride the trend. The chart above illustrates the strategy, with two great entries on the long side after a golden cross formed.
- Bearish cross – the SMA (50) crosses below SMA (200). The reverse of the above strategy applies.
Bollinger Bands in Forex Trading
Bearing the name of the now famous John Bollinger, the Bollinger Bands indicator is a beautiful tool to ride a trend. And, sometimes, it hints to changes in volatility and direction too!
The Bollinger Bands indicator has three lines:
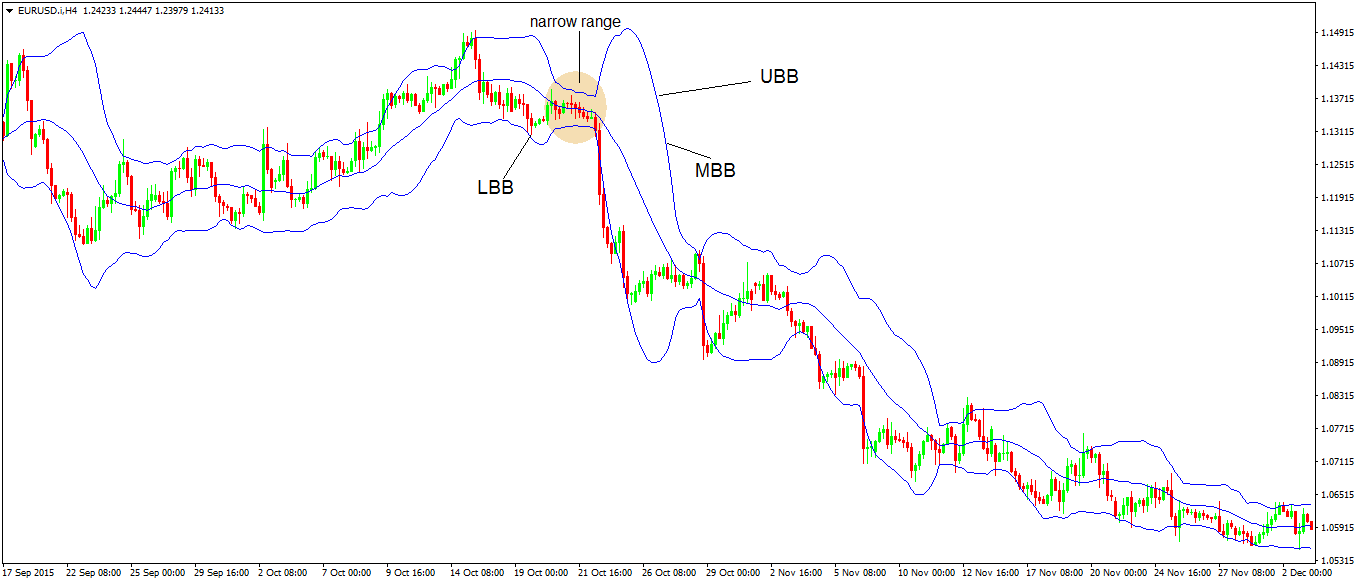
- UBB – Upper Bollinger Band
- MBB – Middle Bollinger Band
- LBB – Lower Bollinger Band
Is good to know the MBB is typically an…EMA (Exponential Moving Average) with the 20 periods. Some strategies use an SMA, but the EMA “comes closer” to prices. For this reason, it works better with Bollinger Bands strategies.
Naturally, the standard interpretation means that the price action is bearish while between MBB and LBB. And, when it tries for the UBB, most of the time it finds resistance (an area difficult to break, used by traders to add to a current position).
The opposite happens in a bullish trend: the price stays in the upper channel depicted by the Bollinger Bands indicator. But there’s more to this indicator, besides riding a trend.
When the market consolidates ahead of a significant event, or just due to lack of liquidity, the UBB and LBB narrow. They signal a potential break.
In other words, the Bollinger Bands acts like a volatility indicator, able to suggest when important breakouts come.
The chart above shows it correctly. The narrow range indicated a break, and the break came.
Simply wait for the price to break below the LBB (in this case a bearish break, traders want to go short) and go short with a stop loss at the UBB. Remember to set the target or the take profit at least two times the risk. More about money management and how to calculate risk, in the chapters to follow in our Trading Academy.
Conclusion
Besides Moving Averages and the Bollinger Bands indicators, other trend indicators help in Forex trading. Moreover, the strategies showed here represent their standard uses.
Ichimoku Kinko Hyo, Envelopes, Parabolic SAR, etc., they all show the same thing: the trending nature of a market.
In the end, the most important is to integrate the indicator into the risk management strategy. For this, you need a clear entry, stop loss, and take profit, just like we explained a bit earlier in this article.
In the next article, we’ll deal with the most popular oscillators, and you’ll see the difference between the two categories more clearly.