

Elliott Waves Theory - Price and Time Explained
One of the most complicated trading theories, the Elliott Waves Theory uses patterns to forecast future prices. Labeled with numbers or letters, the waves/cycles described by Elliott give amazing insight to trades.
The main problem with this theory is that the rules were written for the stock market in the first part of the 1930’s. Applied to today’s Forex trading, the Elliott Waves Theory requires more work and attention to the smallest details.
Ralph Elliott discovered that the market forms various cycles. Moreover, each cycle has two phases: an action and a reaction. Or, more precisely, an impulsive and a corrective wave.
Labeled with numbers, impulsive waves are of three types:
- 1st wave extension – the 1st wave is the longest one in the entire sequence
- 3rd wave extension – the 3rd wave is the extended one, and it is by far the most common impulsive pattern
- 5th wave extension – very rare, an impulsive wave like this one has the 5th wave as the longest one in the structure
Corrective waves are of two types:
- Simple corrections
- flat patterns – labeled with a-b-c, only the c-wave is an impulsive structure
- zigzags – still with a-b-c, but both the a- and the c-wave are impulsive
- triangles – labeled a-b-c-d-e, all five segments show corrective activity
- Complex corrections
- corrections with a small x-wave
- corrections with a large x-wave
In Forex trading, the likelihood is that traders end up labeling more corrective than impulsive waves. The reason is that the market spends a lot of time in consolidation as it is mostly a news-driven market, rather than a volume-based one.
But the corrective waves are one of the most potent patterns within the theory. Some of them allow traders to use time as a variable part of the final forecast. Therefore, it gets as close as possible to the holy grail in Forex trading: price and time.

Price and Time in Forex Trading
Regardless of the trading method used, the aim is to forecast future prices. However, everyone focuses only on price, which is normal.
But what if it would be possible to forecast also the time? What if, some patterns, will give you a clue not only what the price will be, but also the time when the market will get there?
Elliott wasn’t the first one to tackle this subject. Great traders like Gann for example, used time frequently in their analysis.
The argument for knowing the time for a trade to reach a target is that it saves money. For example, if you’re telling me that the EURUSD pair goes to 1.40 but don’t put a time on the forecast, I may lose interest in the trade.
The reason is that the costs vary. Nowadays, the EURUSD pays a negative swap (interest rate differential of the two currencies that are part of the pair).
It means that at the end of each trading day, when positions are rolled-over to the next day, a certain amount is deducted from the trading account. Depending on the volume traded, it can be significant.
Therefore, if there’s a possibility of knowing not only how much the price will move, but when, traders will avoid unnecessary costs as the ones explained above.
In other words, the time has an equally important role in a forecast.

The Elliott Waves Theory is the only one that describes conditions for the price to reach a certain level at a specified time. Hence, price and time with Elliott Waves Theory do exist. The problem comes from understanding the conditions needed for the proper forecast.
Trading the B-D Trendline of a Contracting Triangle
A perfect example comes from trading a contracting triangle. Because triangles are the most common way for the price to consume time, they often appear on a Forex trading chart.
For this reason, understanding the price and time function on a contracting triangle gives traders excellent opportunities to trade. Not only that one may trade the b-d trendline’s break directly, but also the post-break price action.
Elliott stated that a triangle, with its five segments, is labeled with a-b-c-d-e. But a triangle’s shape appears evident by dragging its two trendlines: the a-c and b-d.
If the two trendlines converge towards a common point (called the triangle’s Apex), the triangle contracts. The market forms a contracting triangle.
If, on the other hand, they expand, the market forms an expanding triangle. Between the two, the contracting triangle appears more often, but the rule of the b-d trendline’s break is the same on both types.
The b-d trendline’s break signals the end of the triangle’s consolidation. Hence, this is what the traders focus on as it gives the opportunity for a good trade.
The price and time rule when trading a contracting triangle says that:
- the price must break the b-d trendline in less than the time taken for the e-wave to form.
A simple rule like this is enough to validate/invalidate a potential triangular formation. Because it is mandatory, the price MUST do that, or the triangle isn’t completed.
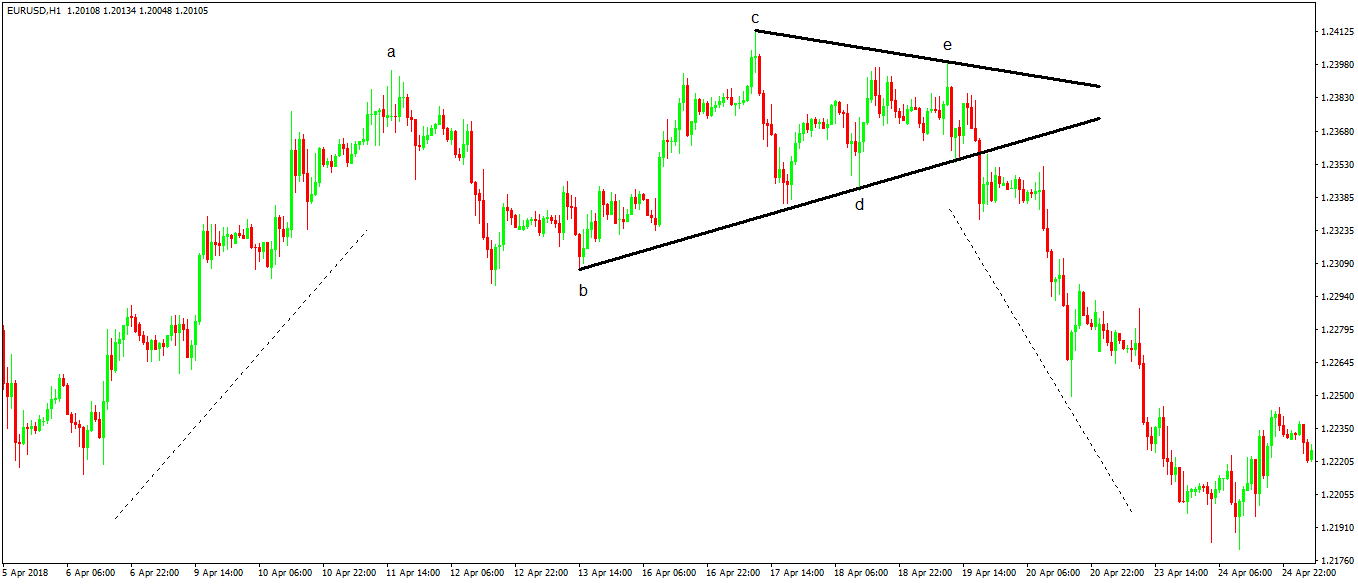
Following the rule explained earlier, have a look at the recent EURUSD price action around 1.24-1.25. The pair had a tough time continuing higher, with record levels of traders being on the long side.
In this case, the triangle formed at the end of a bullish trend, then the price broke lower. Thus, it acted as a reversal pattern.
The b-d trend line must be clean, with no parts of wave c or wave e to pierce it. Plus, the time rule will confirm if the break is for real or not.
Imagine putting the e-wave on the previous swing higher, on the left side of the actual position on the chart. It wouldn’t be possible because in that case, the b-d trendline will break in more than the time taken for the e-wave.
Small details like this one are good enough for validating a pattern. Moreover, they are essential because they give the exact end of the triangle (also the end of the previous trend) and the start of the new trend.
Conclusion
In this case, the triangle acted as a reversal pattern on the hourly timeframe. Sometimes the price retests the b-d trendline, making it a beautiful place to take a trade.
Ideally, the stop loss is set at the previous swing’s high and a take profit follows a minimum 1:2 or 1:3 risk-reward ratio.
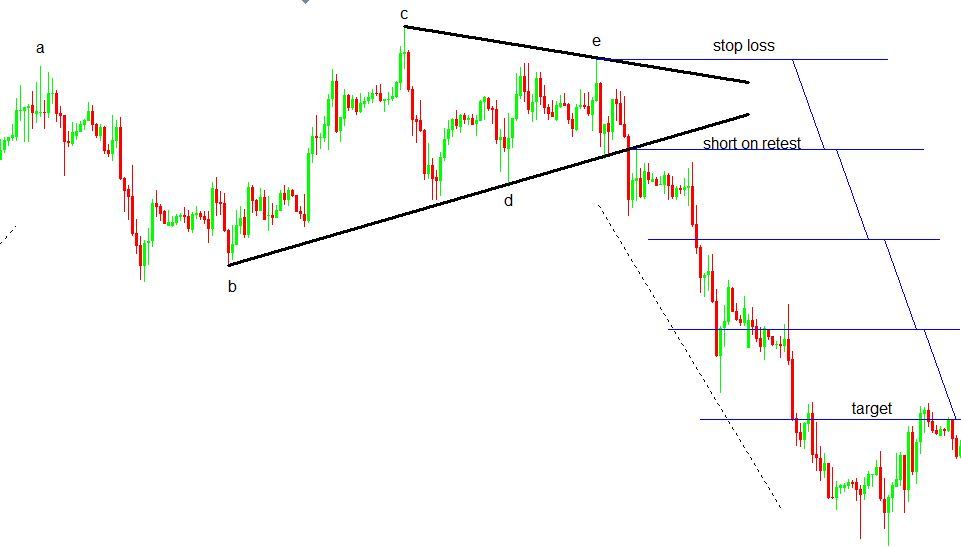
In this case, the price and time rule had the role of confirming the triangle. The confirmation, on the other hand, was enough for traders to wait for the retest of the b-d trendline before going short.
Had the time not been confirmed, the so-called break was fake, and this trade should have been skipped.
The b-d trendline’s break is just one way to use the price and time together. The theory is full of small details when traders must look at both the time and the price.
For example, Elliott stated that every simple correction must be confirmed by the price that followed. As you probably guessed, the confirmation comes from a time rule: the price must do something for a specified period.
If it doesn’t, the correction isn’t simple, but complex. Thus, the Elliott analysis changes from interpreting a simple correction to interpreting a complex one. Traders will focus on what kind of a complex correction the market will form next: one with a small or large x-wave.