

Elliott Waves Theory: Explaining the Waterfall Effect
Throughout this Trading Academy, we’ve covered numerous articles dedicated to the Elliott Waves Theory. From basic to advanced levels, the theory evolves in a logical process unseen in any other technical analysis concept.
Technical analysis in Forex trading, Elliott Theory included, depends on a high proportion of the Fibonacci series. The Fibonacci trading tools appear on every Forex trading platform, and traders use them in various ways like:
- to find out the golden ratio (61.8% retracement) as a natural retracement for any given move
- to scale into a position, looking to add on dips or spikes when the price reaches a specific Fibonacci ratio (23.6%, 38.2%, and so on).
Ralph Elliott built the entire trading theory surrounding the Fibonacci ratios. All the patterns he ever documented have a Fibonacci relationship, either internal (refers to the waves of the same degree) or external (refers to the waves of a bigger degree).
Here are some of the ways Elliott Theory uses Fibonacci ratios:
- the b-wave of a flat must retrace a minimum of 61.8% of the previous a-wave
- the b-wave of a flat must not retrace more than 61.8% of the previous a-wave and most of the times retraces between 23.6% and 38.2%
- the c-wave of a flat exceeds 161.8% of the b-wave only in an elongated pattern
- if the c-wave of a flat exceeds 138.22% of the previous b-wave, the market won’t have the power to retrace the c-wave anymore fully
- the b-wave of a triangle cannot travel more than 261.8% of the previous a-wave
- the b-wave of a triangle rarely stops at 61.8% of the previous a-wave
The list can continue for a long time, but it is not the purpose of this article to list the Elliott and Fibonacci ratios utility. Instead, we will shift the focus to complex corrections.

Complex Corrections in Forex Trading
When the market doesn’t confirm a correction as a simple one (refer to the time rule presented in the previous article), it must form a complex correction.
A complex correction has either one or two intervening waves, but never more than two. The connecting waves are labeled with the letter x and also have a corrective nature.
Based on the x-wave’s length, a further division is made. Because the x-wave connects two or three simple corrections, its length refers to the previous correction.
As a rule of thumb, any complex correction under the Elliott Waves Theory should not start with a triangle. That’s impossible.
Hence, Elliott leaves only two other options on the table: a flat or a zigzag at the end of a complex correction. Between the two, look for a flat to form more often.
The key then is to measure the length of the entire first correction and check if the x-wave retraces (ends) beyond 61.8% of it. If it does, the market forms a complex correction with a large x-wave. If not, it forms a complex correction with a small x-wave.
Out of the two possibilities, the chances are that it’ll form a complex correction with a small x-wave. While not a rule, if we use some percentages, the famous Pareto principle applies here too: some eighty percent of the cases will see the market forming a correction with a small x-wave, and the rest belongs to complex corrections with a large x-wave.
Because in Forex trading volatility reaches extreme levels, it is essential to consider the end of the x-wave, not its highest or lowest point.
The Waterfall Effect in Forex Trading
One of the most impressive ratios Elliott found was the so-called waterfall effect. He used it only in complex corrections with a small x-wave. More precisely, in triple combinations.
In terms of Elliott Waves Theory, such a correction is labeled: (a-b-c)-x-(a-b-c)-x-(a-b-c-d-e). Using what we already covered in this Trading Academy in the articles dedicated to the Elliott Theory, the structure above tells us that:
- the first a-b-c is either a flat or a zigzag
- the second a-b-c is also either a flat or a zigzag
- a triangle always ends the pattern
All combined with the fact that the x-waves do not retrace more than 61.8% of the previous correction. Hence, the first x-wave relates to the first a-b-c and the second x-wave to the second one.
Here’s the terrific drop on the AUDUSD pair from a little over parity. In less than four years, it lost over forty percent of its value, leaving many traders scratching their heads.
But when it started, it started with a flat pattern (in black). It formed a wave-a, then a b-wave in black that ended beyond 61.8% of the previous a-wave, and then the c-wave in black stretching over 138.2% of the previous b-wave.
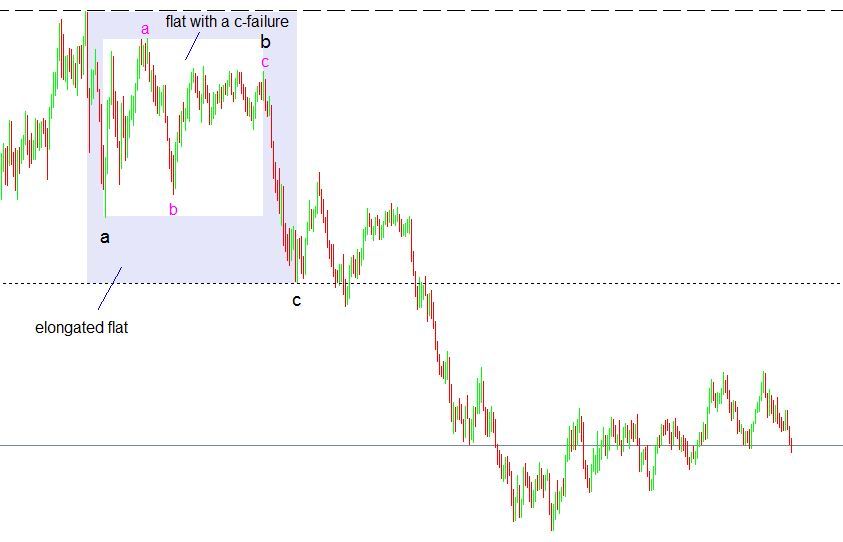
The length of the c-wave in black tells us this is an elongated flat, while the b-wave formed a fantastic flat with a c-failure. Elliott stated that any pattern that shows a failure is a sign of a countertrend strength. Hence, the failure corrected a bearish move, so the countertrend was still to the downside.
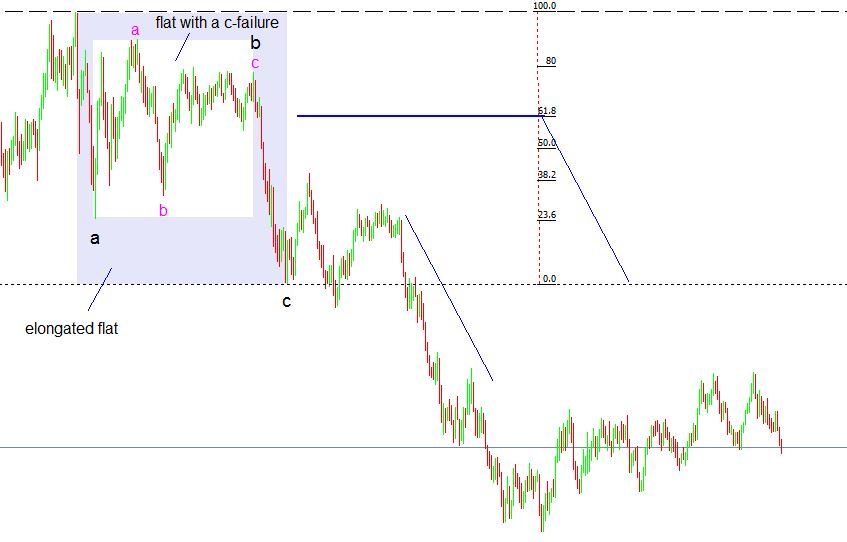
Next, traders measure the length of the entire a-b-c in black. The pullback, or the x-wave, should not retrace beyond 61.8%.
A quick look below reveals that we don’t see such a pullback.
However, for the waterfall effect, we use the golden ratio to project the second correction’s length.
How to Project the Second Correction
The image above is self-explanatory. These steps will result in finding the end of the second correction using the waterfall principle:
- find out the 61.8% measurement of the first correction
- project it from the end of the first x-wave
- around that level, the market ends the second correction before the last x-wave in the pattern
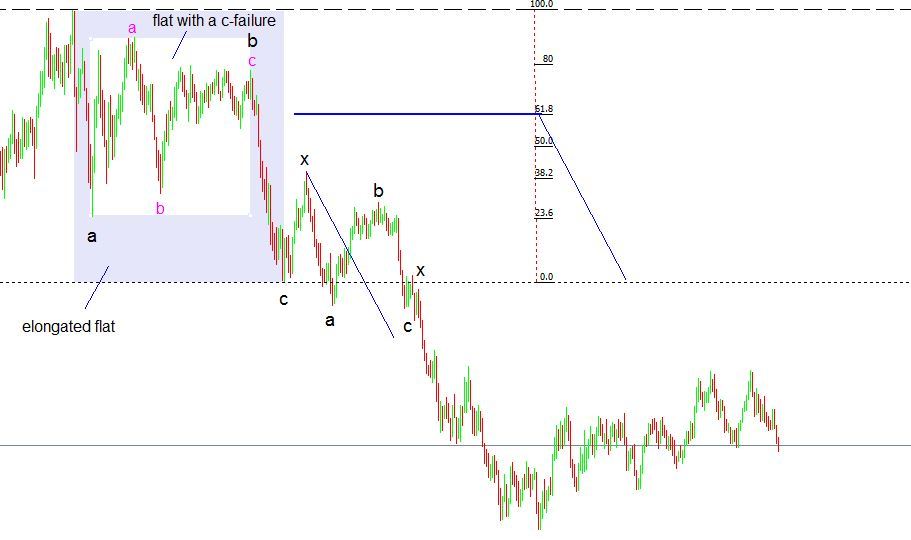
Following the steps from above, the second a-b-c ends around the 61.8% of the previous correction, projected from the end of the last swing (x-wave). This way, the waterfall effect gave us the two corrections in the triple combination, and we already know what’s about to follow: a triangle.
Conclusion
The waterfall effect acts as a confirmation that the market forms a triple combination. Without it, the triple combination doesn’t exist.
The beauty of the Elliott Waves Theory comes from the implications of every count. For example, if the market forms a triple combination, the price MUST respect the waterfall rule explained here.
If the Forex trading scenario includes a triple combination, traders jump to the next thing implied: where does it form? Elliott found triple combinations forming mostly as the longest wave of a contracting triangle. Hence, the bias is that the market forms a leg of a contracting triangle, either the a-wave or the b-wave.
Furthermore, in the analytical process, the implications are that the moves or segments to follow the triple combination will all have a corrective nature since all the legs of a triangle are corrective.
Without the waterfall effect confirmation, this logical process won’t be possible. Sound complicated?
Perhaps now, traders saying Elliott Waves Theory is simple will think twice. Ignorance and lack of proper education lead traders into thinking of the labeling being easy. In fact, it is one of the most complex and analytical trading theories ever created.
To sum up, traders use the waterfall effect to confirm a triple combination. Then, they use the triple combination to prove the presence of a triangle.
Next, they use the triangle as part of a complex or simple correction of one higher degree. And so on, until all the dots are connected and the path forward on the right side of the chart is clear.