

Buying Overbought and Selling Oversold: Does it Work
In the field of technical analysis, oscillators play a crucial role. Based on the sophisticated mathematical formula, they calculate current levels using historical data.
Forex trading adopted oscillators readily. That’s especially true in the case of retail traders.
Because retail traders mostly scalp (keep positions open for a short period to profit from small market moves) and rarely swing trade or invest, they tend to look for market turns. More precisely, they try to pick tops or bottoms.
That’s a dangerous approach to Forex trading, as catching a falling knife isn’t something for the inexperienced. When doing so, retail traders mostly use oscillators.
We have covered, in previous articles of this Trading Academy, the way to use oscillators:
- buy oversold and sell overbought areas
- buy a bullish divergence and sell a bearish one.
But despite the standard interpretation mentioned above, most of the resulting trades fail. If you have ever used oscillators in your Forex trading, how many times did the market do just the opposite of what it was supposed to do based on the standard interpretation? The answer is too many times.
Hence, a different approach is long overdue and thinking out of the box might not be the worst idea. After all, one needs to be creative to make it in the most challenging market in the world.
Defining Overbought and Oversold Levels
Overbought and oversold levels are extreme areas reached by an oscillator. They vary from oscillator to oscillator, but the standard idea is the same: when the oscillator reaches such levels, the trader should open a position in the opposite direction.
The most known oscillators have such levels:
- RSI (Relative Strength Index) has the 30 and 70
- DeMarker has the same levels
- Stochastics has the 20 and 80
Even those that don’t have some defined levels to express extreme areas, traders can easily mark them. Just check historical data and see when the oscillator made a move out of the ordinary. Next, mark that level with a horizontal line. And finally, use that for future developments, as an extreme level either in the overbought or oversold territory.
Most trading courses advise traders to stick with the oscillator’s move instead of the price. Because the oscillator considers multiple periods before plotting a value, traders place more trust in it.
But we already explained that selling in overbought and buying in oversold works only under certain conditions. Namely, only if the market is in a range.
However, when the Forex trading environment shows trending conditions, you’ll find that the oscillator reaching overbought territory was a good sign to go long, not short.
Therefore, the question arises: is there a possibility to establish a set of rules for buying in overbought and selling in oversold? Or, to do precisely the opposite as conventional wisdom in technical analysis says?
Defying Conventional Wisdom with the RSI
As the most popular oscillator, it is only rational to use the RSI. We’ll use the standard 14-period, the one that comes with the default settings.
Keep in mind that the bigger the period is, the flatter the RSI line becomes. Hence, the more difficult for it to reach the overbought or oversold levels.
Or, the fewer periods considered, the easier for the RSI to reach extreme levels. In fact, this is valid for all oscillators, not only the RSI.
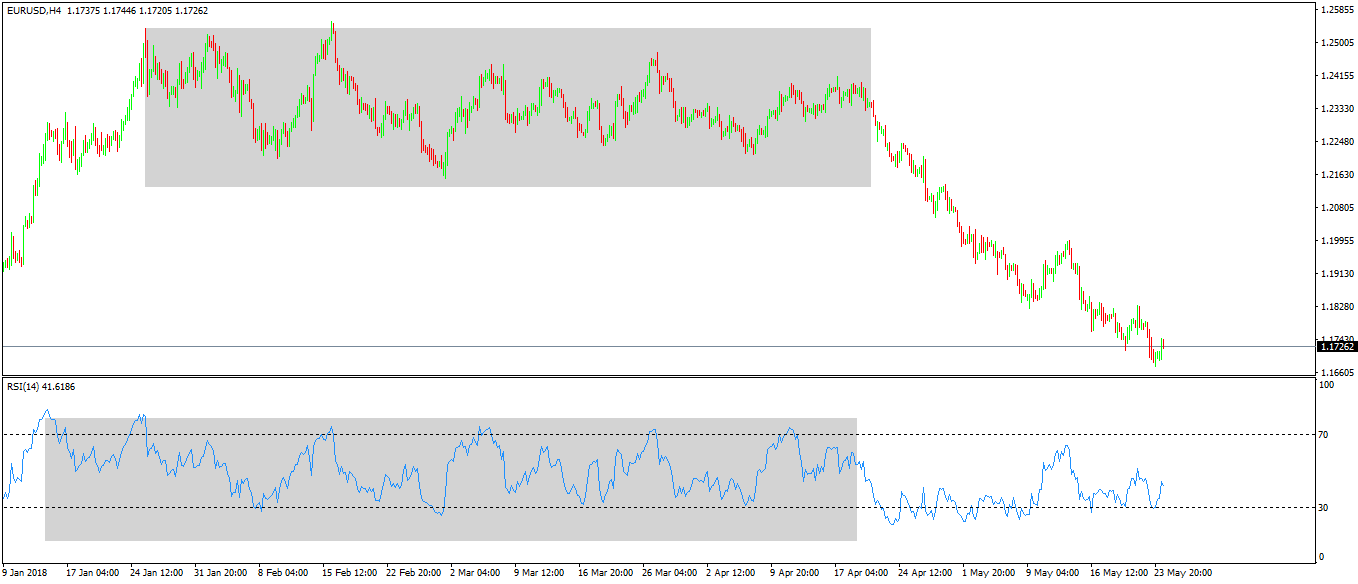
The chart above shows the recent EURUSD price action. Moreover, the two grey areas highlight the price and the RSI reaction as long as the EURUSD held the range.
Naturally, using the conventional approach works in ranges. So, buying oversold and selling overbought would work excellent in this range too. However, how about when the range ends? What to do?
For this, traders need to define the range. That’s simple, just use horizontal lines to mark up the highest and the lowest points. For as long as the price remains in the range, use the conventional approach. However, tactic change when trending conditions appear.
Using Oversold Markets as Continuation Patterns
In Forex trading, the brave ones stand to win the most. It doesn’t mean that the standard interpretation is wrong but having the will to do the opposite than the crowd requires some guts and an open mind.
However, even when doing that, keep in mind to always have a plan to follow. Namely, an entry and an exit, as well as a stop loss in place.
The range eventually broke lower on the EURUSD pair. And, the RSI, which follows the price, reaches oversold territory as it did so many times when the range held.
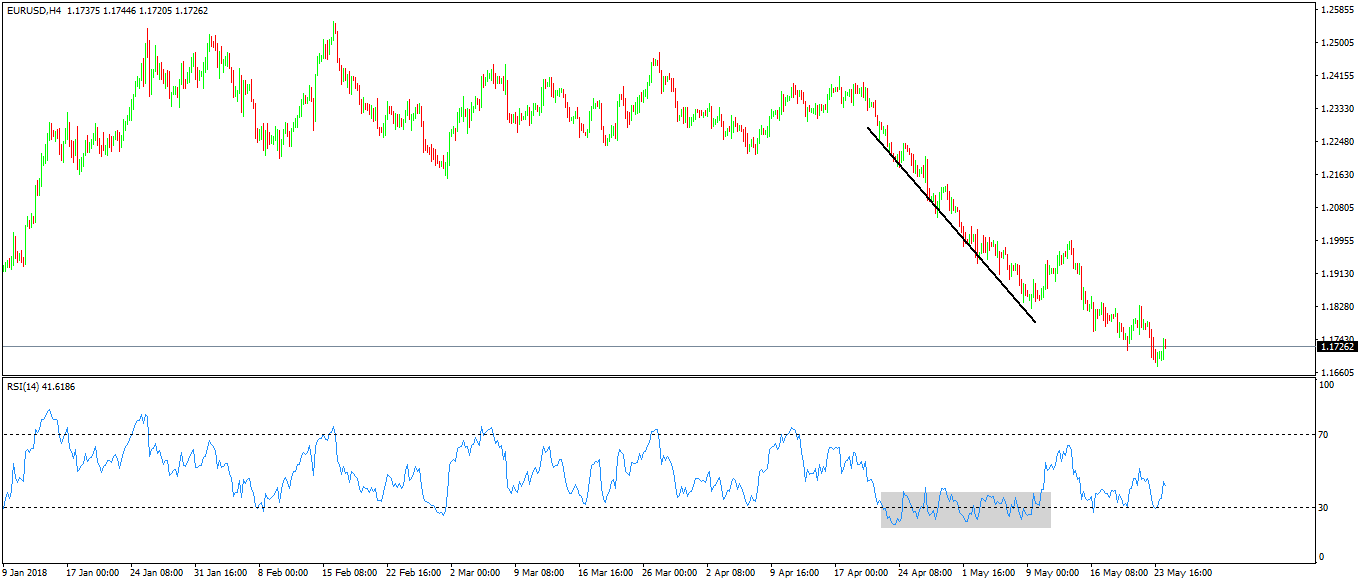
However, this time is different. As the price broke the range lower, the implied probability is that ranging conditions are long gone, and a trend follows.
Hence, buying in oversold isn’t going to do the trick anymore. As the chart above shows, for as long as the RSI remained in oversold or around the oversold territory, the EURUSD bearish trend had a steep angle capable of taking out even the bravest traders.
Therefore, instead of embarking on such a painful trade destined to wipe out the gains made when the pair ranged, why not do the opposite? Why not use the oversold territory as a continuation pattern?
For this, we need to have a trading plan. Here are the rules:
- alter the RSI by adding another level: the 50. That’s easy to do on any trading platform. For the MetaTrader4, just right-click on the chart, choose Indicators List, then Edit the RSI with the desired level. That’s the stop loss for a short trade in oversold territory.
- sell when the RSI dips below 30, with a stop loss at 50.
- take the profit on the next dip below 30.
- rinse and repeat
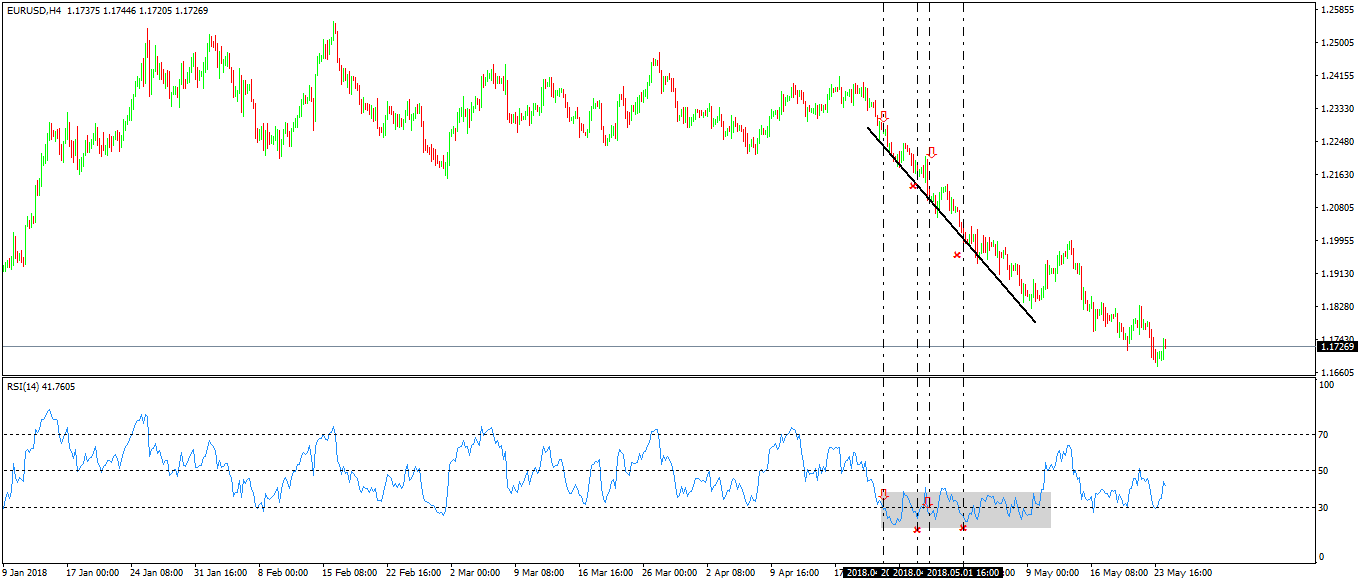
The approach gave two trades by using the oversold area as a continuation pattern, and the trend kept moving.
However, look for taking no more than two trades on any setup. There’s a reason for that, and it has to do with the RSI’s ability to pop above the 30 level.
In super strong trends, it won’t pop often. Hence, look for the inability to stay below 30 to signal a change in trending conditions.
In any case, using the approach on various currency pairs and different timeframes is enough for profiting on most trends on the market.
After two successful trades, the idea is to look for possible reversal patterns. We’ve covered most of the critical reversal patterns in this Trading Academy, and here the EURUSD seems to form a falling wedge.
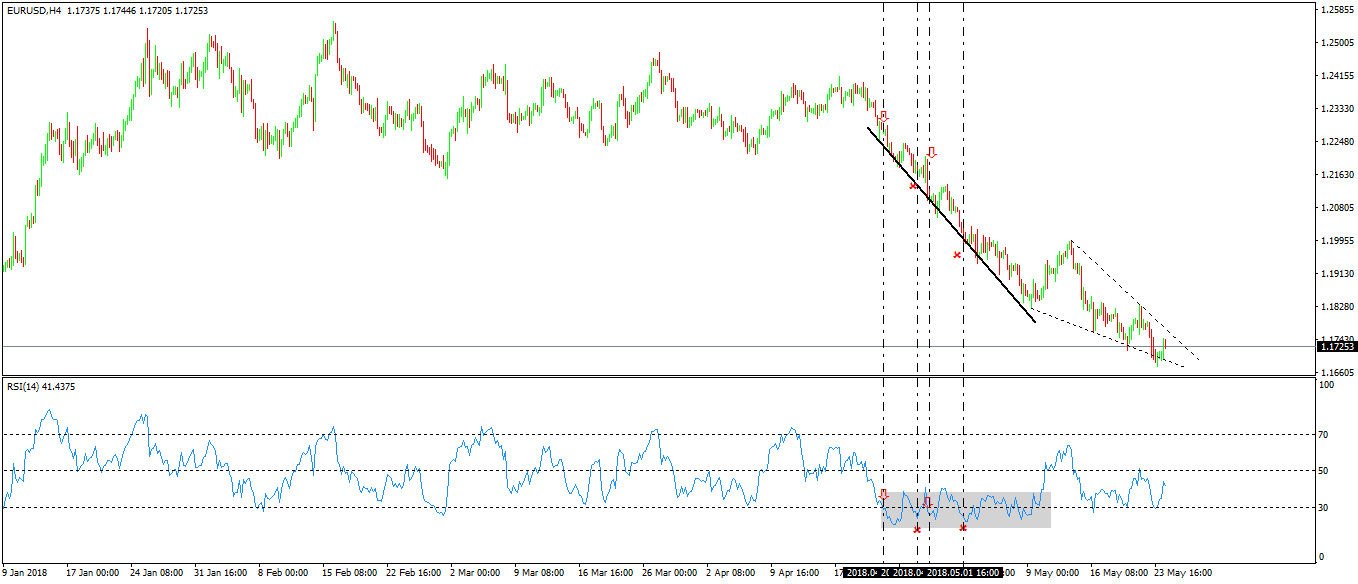
So, even if the price did move lower, it makes sense to look for a reversal as the RSI already popped above 50, and the price forms a possible reversal pattern.
Conclusion
A market can stay in overbought or oversold levels for a long time. Also, it may remain in a bullish or bearish divergence mode for even longer.
Finally, when the traders give up, the market eventually turns.
When looking for a reversal after a successful two trades using overbought or oversold as continuation patterns, focus on confluence areas. Look for more factors to point to a possible reversal, and trade small: catching a falling knife is a risky approach even after the price spends so much time in oversold territory as it did in the examples used here.