

Pattern Recognition in Forex Trading: Head and Shoulders
From the Western approach to technical analysis, the head and shoulders pattern forms at the end of a trend. Not only is it a reversal pattern, but it is one of the most powerful and tricky patterns to trade. That’s especially true in Forex trading.
When first coming to technical analysis, traders turn their heads to classic patterns. The pattern recognition approach is one of the oldest ways to interpret market behavior.
The head and shoulders pattern tends to trap traders. It has three parts:
- Left shoulder. Typically, this is a consolidation area the forms in the trend’s direction. Nothing suggests that the trend will turn. Instead, it looks like a pennant or a bullish flag, dragging more and more traders as a continuation pattern.
- Head. Suddenly, the consolidation mentioned earlier breaks. Everyone is on board again, as the trend resumed. However, it turns out to be a fake break. The market quickly retraces the entire move.
- Right shoulder. After the market retraces the head, it tends to consolidate again. That’s the right shoulder.
Only when the currency pair retraces the head, trader start to suspect a head and shoulders pattern might form. The focus shifts to the right shoulder, and the ways to trade the head and shoulders pattern.
The head and shoulders pattern forms at the end of both bullish and bearish trends. In Forex trading, when it appears after a bearish trend, traders say that an inverse head and shoulders pattern formed.
However, the way to trade and interpret the pattern remains similar in both instances. Let’s have a look at the standard way to trade it and at some out of the box tricks to profit the most from it.
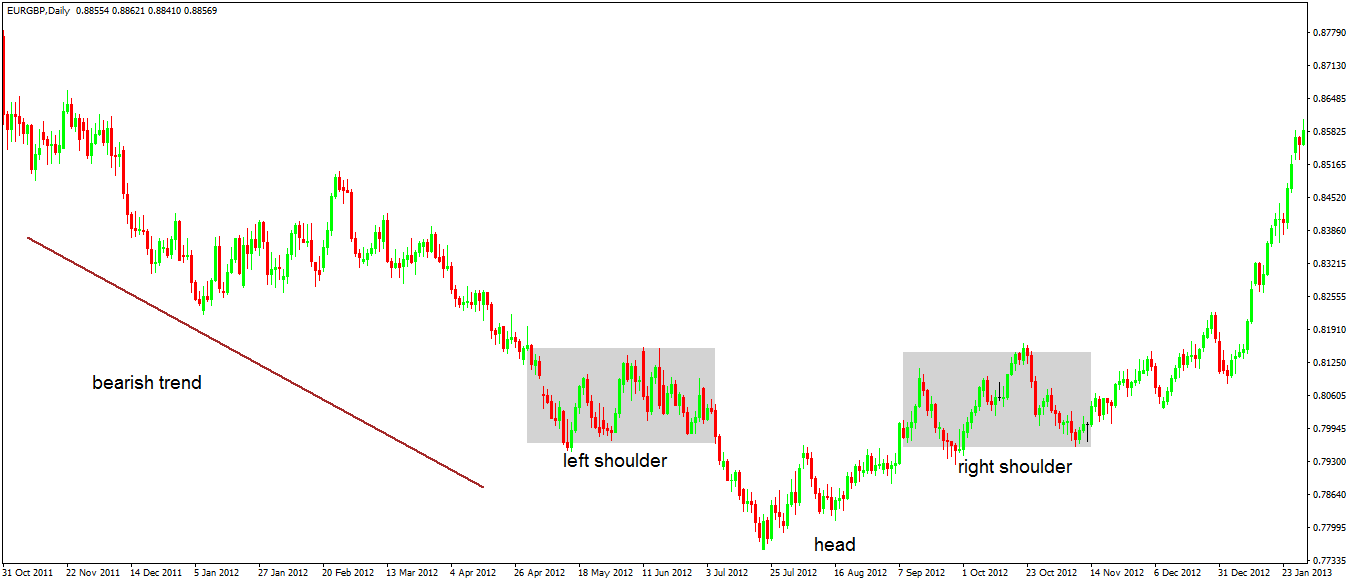
Check the chart above for instance. From left to right, after a bearish trend, the market consolidates.
The consolidation seems to be a descending triangle. After the price breaks lower, bears tried to push the price aggressively.
Shortly after, though, the EURGBP completely reverses the breakout move. After that, a consolidation starts.
This is how the head and shoulders pattern forms. And, from this moment on, traders consider the possibility for the bearish trend to reverse.
Standard Interpretation of the Head and Shoulders Pattern in Forex Trading
The pattern’s name comes from the human body: two shoulders and one head. Based on it, one more element enters into the technical analysis picture: the neckline.
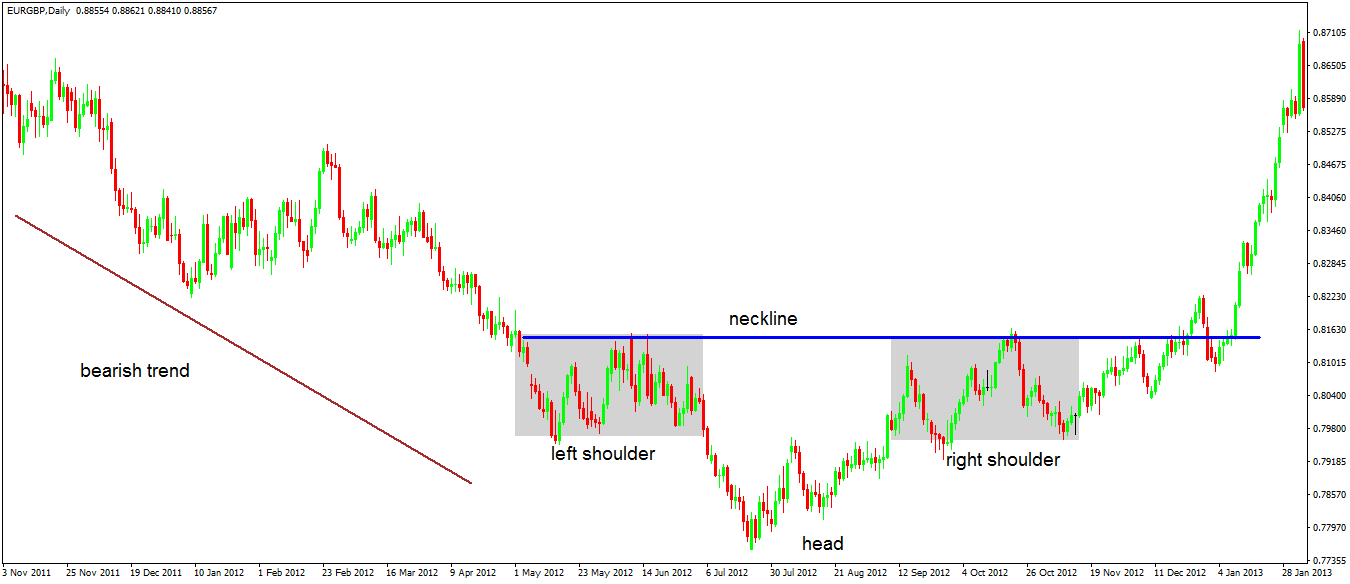
The neckline connects the base of the two shoulders. As such, we can draw it only after the market finishes the left shoulder’s consolidation and the head moves.
In this example, the neckline is horizontal. But in Forex trading, that’s quite an exception, rather than a rule.
Because Forex trading is known as the most volatile market in the world, rarely we can draw the neckline on the horizontal.
From the moment the price breaks the neckline, traders enter a trade having a target in mind: the measured move.
To calculate it, just take a line and measure the distance from the top of the head until the neckline. Next, project it from the neckline and that’s the take profit.
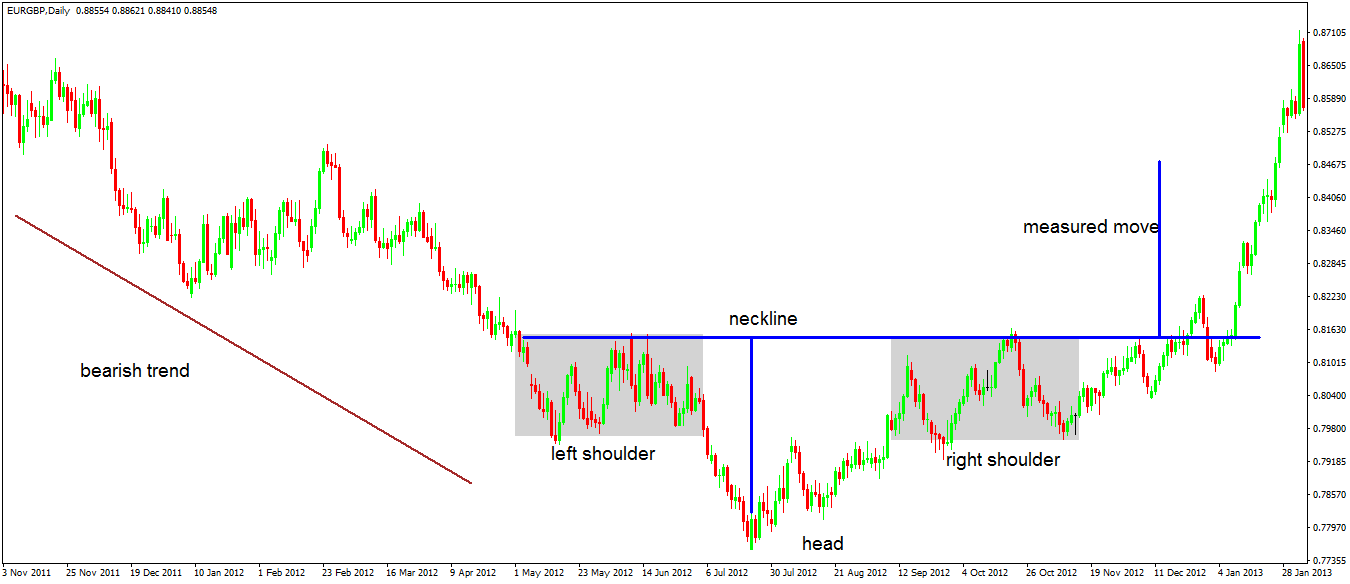
Unfortunately, the pattern doesn’t offer a tremendous risk-reward ratio. The absolute invalidation of it happens if the market has the power to push beyond the head’s maximum value.
While not a rule of thumb, almost always the price retests the neckline. That’s a great place to enter a trade, and many traders just wait for a retest to happen.

Projecting the Neckline for a Great Risk-Reward Ratio in Forex Trading
A simple money management rule says that the risk-reward ratio of any trade must exceed 1:2 (target double the distance risked). In this case, if the entry place is on the neckline’s breakout point or retest, and the invalidation is at the lowest point of the pattern, the risk-reward ratio doesn’t allow the trade.
Because the head and shoulders pattern is a reversal pattern, the measured move is just an estimation of the future target. Traders use it to book partial profits, raise the stop loss at break-even, and trail the stop to make the most of the new trend.
But there’s another way to minimize the risk while keeping the reward intact. The neckline’s projection helps to achieve that.
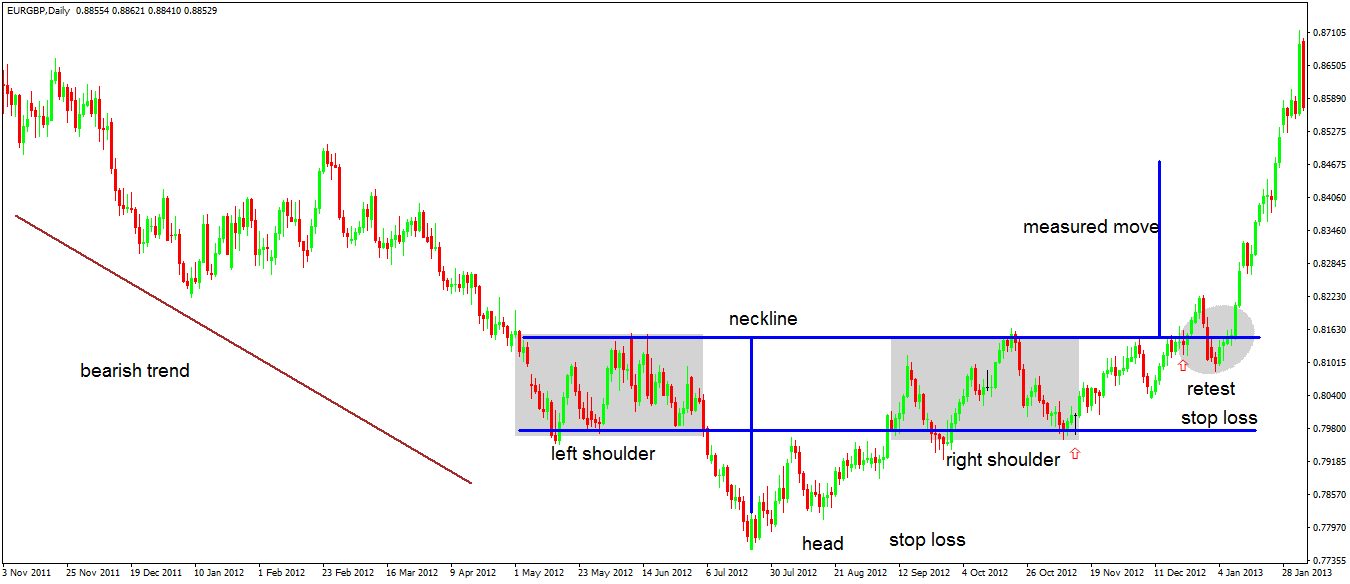
It all starts with the left shoulder. Keep in mind that by the moment we can draw the neckline, the left shoulder’s consolidation already exists. Hence, we use information from the left side of the chart to project future levels.
The idea is to copy the original neckline and paste it from the bottom of the left shoulder. As a result, the line provides two amazing opportunities:
- It gives a great entry during the right shoulder’s consolidation. Before the neckline’s break, the price comes into its projection. Aggressive traders place a stop loss at the bottom and set the take profit for the measured move.
- It gives a stop loss after the price breaks the neckline. As such, the measured move’s distance makes sense from a money management point of view
Pros and Cons of the Head and Shoulders Pattern in Forex Trading
On the pros side, the pattern still works. While financial markets evolved in time, as new ones like Forex trading appeared, the pattern still works.
But, not always. Nowadays, with artificial intelligence, trading algorithms, and quants, super-computers learned to spot classic recognition patterns.
It is not rare for the market to break beyond the neckline, in what turns to be a fake move. A sharp reverse follows, invalidating the pattern.
Ironically, the bigger the time frame, the worse for the pattern. The fact that everyone can see it (as everyone knows about it) doesn’t bode well for a trade.
Another disadvantage comes from the time taken for it to form. The EURGBP head and shoulders pattern took from May until December to break the neckline.
Compared with other patterns, like the Japanese candlesticks ones, the head and shoulders takes a long time to give a couple of trades, for the same risk-reward ratio.
Conclusion
The head and shoulders pattern reverses a trend. That’s its most important characteristic.
Having said that, the measured move and the way to trade it at the end of the previous trend fade in importance. For this reason, the bigger the time frame, the more powerful the implications are.
However, on bigger time frames, they are easy to spot. Look for a classic pattern like the one shown in this article to have little chances to survive.
Instead, opt for ugly ones. Use your imagination and search for a consolidation, followed by a quick spike and retracement to the initial breakout point.
Look for the neckline not to be horizontal, and for the two shoulders to differ both in time and in the distance the price traveled.
One trading theory incorporates the head and shoulders pattern in its concept. The Elliott Waves Theory that we’ll cover later in the Trading Academy, bases many of its rules on triangles.
Believe it or not, when special triangles form at the end of complex corrections, the market creates a head and shoulders pattern. As a result, they are ugly, difficult to spot, and even more difficult to interpret.
That’s a head and shoulders pattern I would like to trade, as it offers a competitive advantage over other market participants.
Next, we’ll have a look at another classic pattern in technical analysis: a wedge. While not that complex as the head and shoulders, it has even more powerful implications.