

Pattern Recognition in Forex Trading: Ascending and Descending Triangles
The foreign exchange market is the most significant financial market in the world. Trillions of dollars change hands every day.
Because of that, volatility measures extreme levels, but only from time to time. People come to Forex trading having in mind the fact that the market always moves.
In fact, the reality differs. The market spends most of the times in consolidation areas. Or, in ranges.
Statistically, over sixty percent of the time the Forex market overall is in a range. Some currency pairs (e.g., majors) spend less time consolidating than others (e.g., cross pairs).
When it comes to a range, a triangular formation is the most common way for a market to spend time. Triangles are everywhere: on every currency pair, and on every timeframe.
The concept of a triangular formation isn’t new. It is actually quite old.
Triangles were the first patterns traders recognized when they looked at the market. As part of the pattern recognition approach to trading, triangles tell a story.
For example, ahead of a crucial economic event, like the CPI (Consumer Price Index – a.k.a. inflation) or the NFP (Non-Farm Payrolls), the Forex market tends to consolidate. What do you think the pattern will be? A triangle, of course!
In Forex trading, triangles have numerous shapes. Because of the volatility involved and the five digits of every quotation, triangles have evolved from their original form.
Ascending and descending triangles were first discovered in stock market studies. Either on individual stocks or index, the market consolidated before a major break.
As such, they represent continuation patterns. Like the name suggests, an ascending triangle has bullish consequences. The price will break higher after the consolidation ends.
The opposite happens when the trend is bearish, and the market forms a descending triangle. The price will break lower, and the bearish trend resumes.
Back in the days when the two patterns were documented, the stock market wasn’t that volatile. We cannot compare it with today’s Forex trading.
As such, ascending and descending triangles formed against a horizontal resistance or support level. Just like in the case of double and triple tops and bottoms, the patterns revolve around a flat level.
While it was common back then, today traders are a bit more flexible due to the aspects mentioned above. Nevertheless, ascending and descending triangles do form, and offer plenty of opportunities to trade.
Ascending Triangles in Forex Trading
As mentioned earlier, an ascending triangle needs a bullish trend. More precisely, a bullish trend must exist before the market consolidates.
The consolidation takes place so that the market consumes time. Typically, that happens ahead of an essential economic release or fundamental event (e.g., elections, referendums, dull summertime days, etc.)
All eyes and attention are on the breakout. When it happens, there’s a precise method in place to trade such patterns.
Because they form so often, the opportunity exists that the methods presented here can be used on any timeframe and currency pair. Here’s how an ascending triangle looks like on the Forex market.
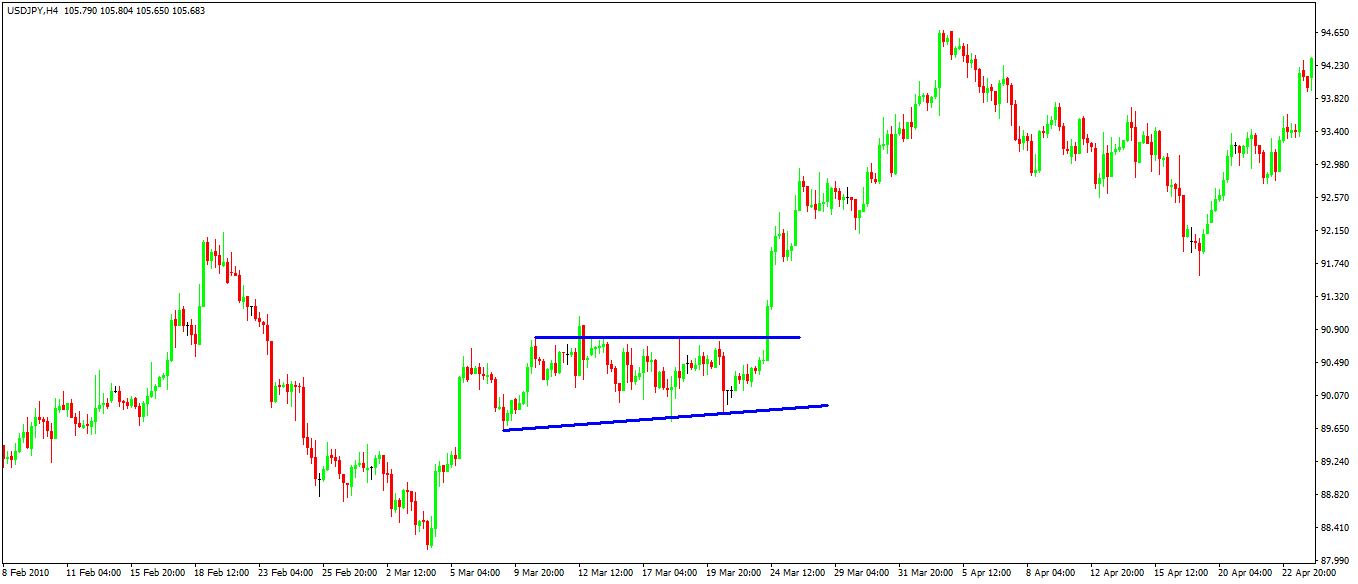
The USDJPY pair jumped from the lows. It broke higher after a falling wedge pattern, but it had a hard time continuing the newly formed trend.
It met tremendous resistance, that formed at a horizontal level. Moreover, the dips created a series of lower highs, which is typical in an ascending triangle formation.
Such a series indicates the price was building energy to break higher. And, eventually, it did.
But, can we put the break into a trading plan? The answer is yes, because ascending (and descending) triangles have a measured move.
First, check the triangular formation and measure the longest segment of it. Typically, it is either the first or the second swing.
Next, project it to the upside from the horizontal resistance level. That’s the measured move, and it represents the minimum distance the price must travel so that it confirms the ascending triangle.
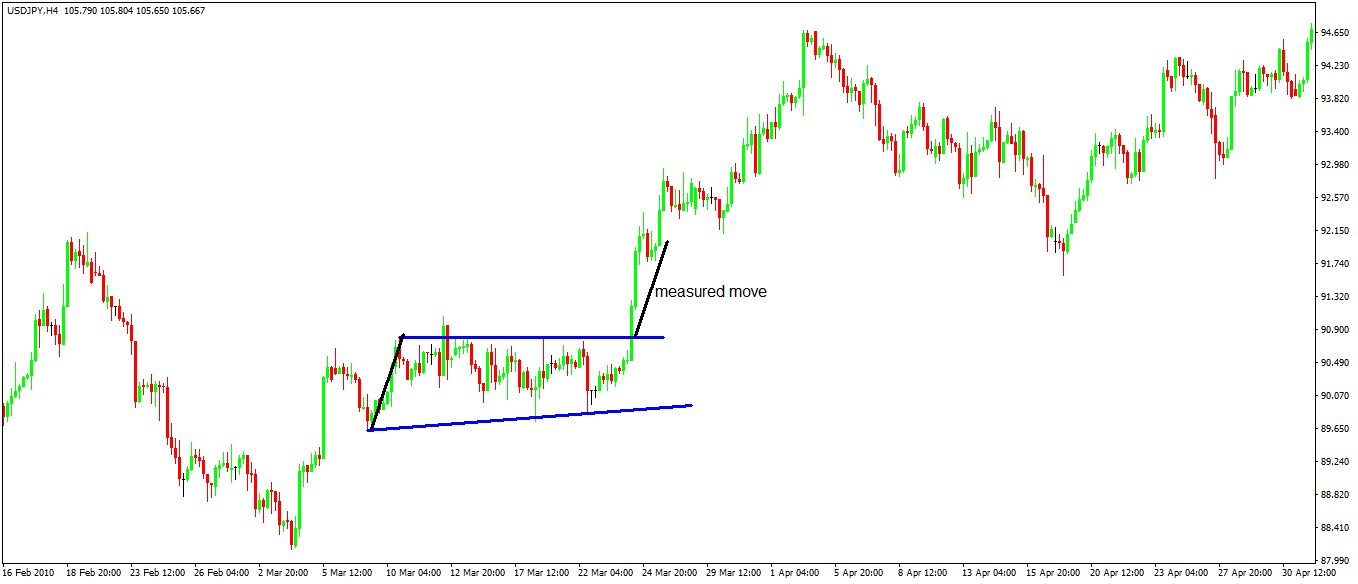
As you can see above, the price broke higher, and the measured move came. However, it advanced still.
Traders exiting at the measured move will remain with the impression that they missed a robust trend higher. To avoid such a thing, the trading plan calls for booking half the profits at the measured move. Next, raise the stop loss at break-even. Finally, set the target for the rest to a 1:2 risk-reward ratio.
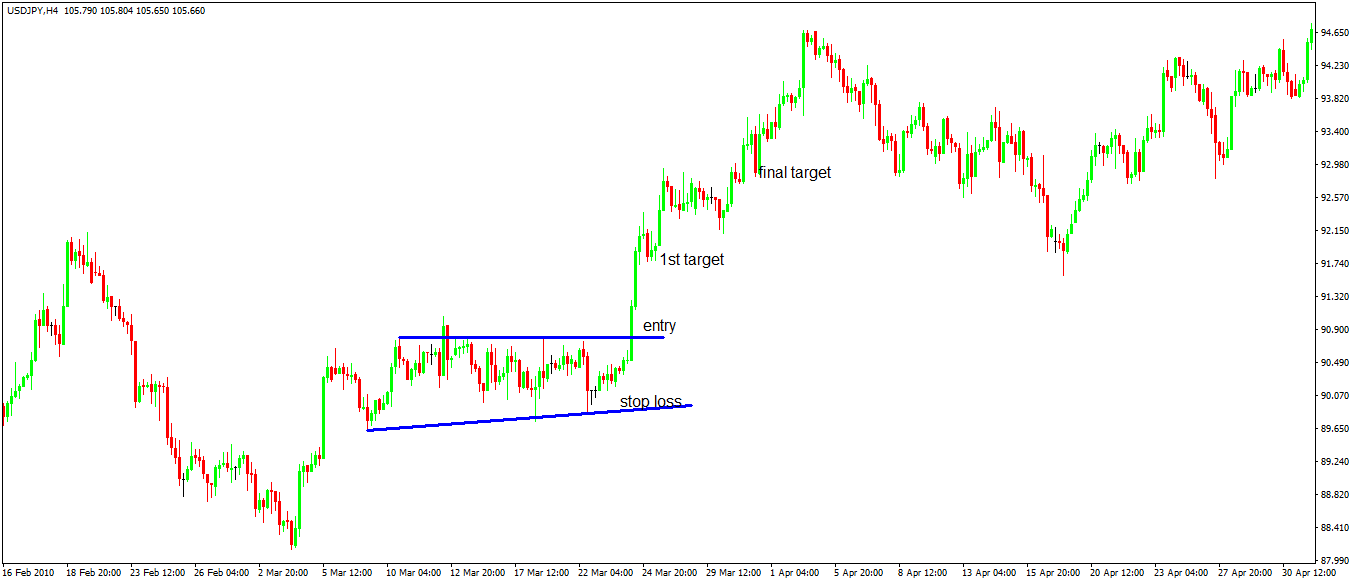
This way, traders make the most of an ascending triangle pattern. Because they form so often, and virtually on all the timeframes, bigger timeframes offer bigger rewards.
In Forex trading, multi-timeframe analysis plays an important role. For example, if an ascending triangle forms on the monthly chart, that’s one way to trade it.
Next, the trader goes on a lower time frame and checks for other continuation patterns or reversal ones. As such, he/she adapts all the time to the new conditions and ends up riding the entire trend, while adding or cutting to/from the initial position.
Descending Triangles in Forex Trading
Descending triangles have a similar interpretation like the ascending ones. The only difference is that they form during a bearish trend.
However, there is a difference between the people’s reaction to a selloff and a rising trend. The fall tends to be more dramatic than the rise, as the panic effect reigns in.
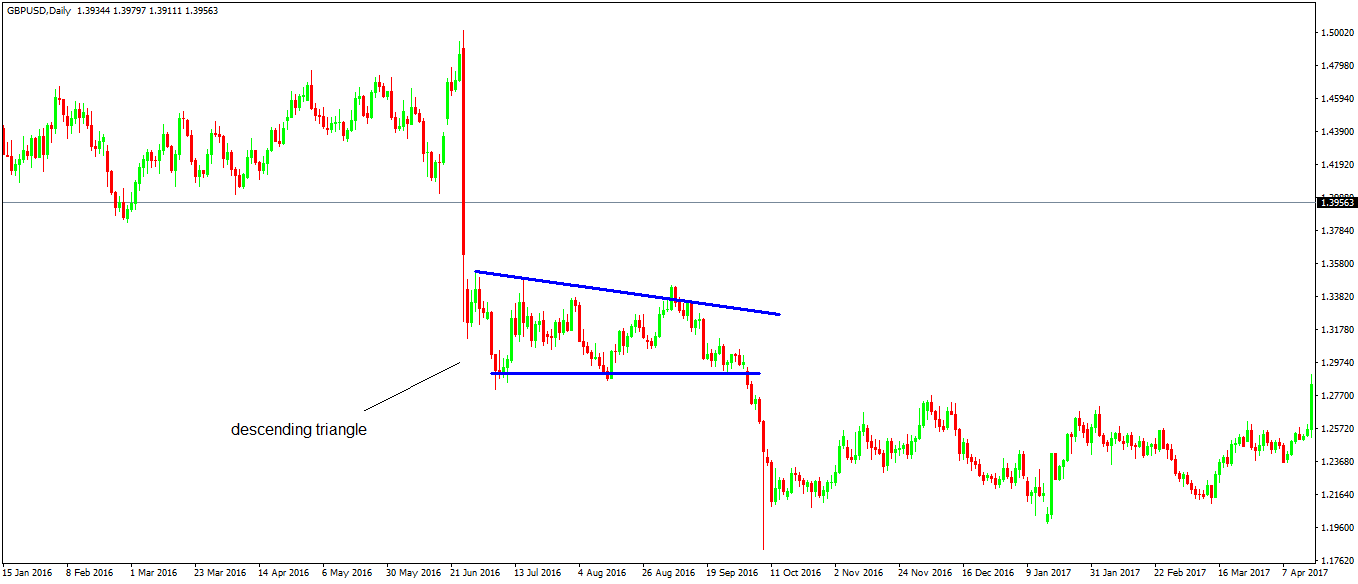
Here’s the GBPUSD daily timeframe, showing the reaction after the Brexit vote. In the summer of 2016, the United Kingdom voted in a historic referendum to leave the European Union.
As a result, the GBP collapsed across the dashboard, with the GBPUSD pair making no exception. That’s the long, red, vertical candle.
What followed was a fifty-two days consolidation area, that found support against a horizontal line. Because the spikes higher followed a lower highs series, the next thing to come to mind is a descending triangle.
Following the same steps as in the ascending triangle’s example, you will see measured move shown in the image below.
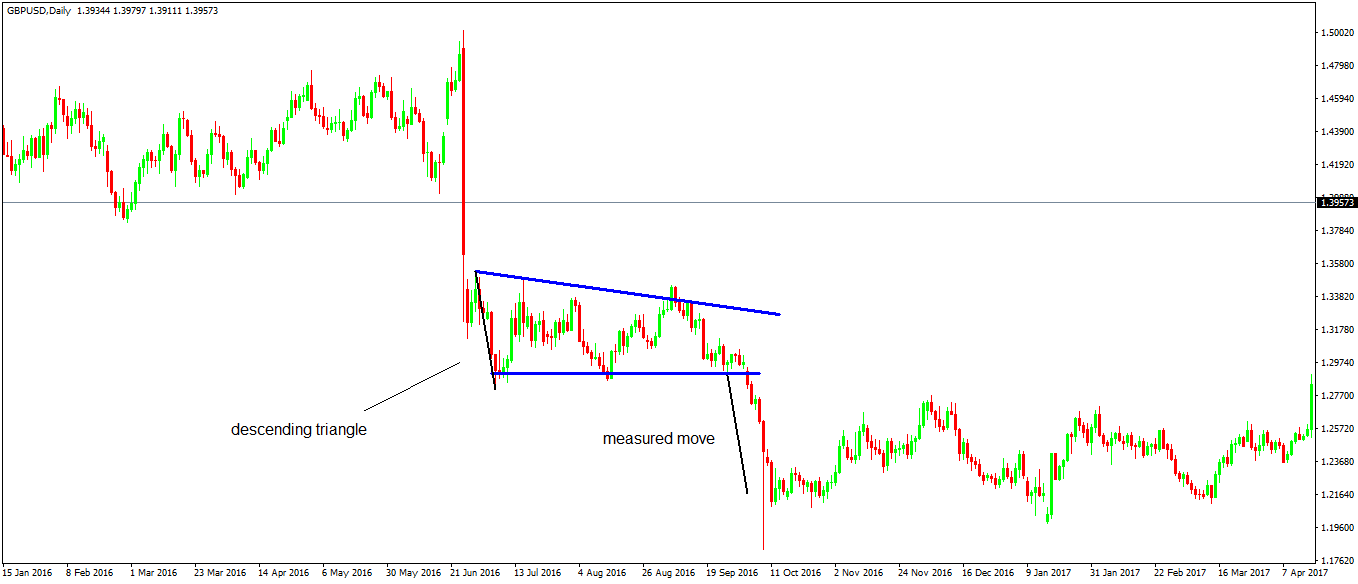
After the measured move, aggressive traders will try to make the most of the new trend. However, in some cases, it works (like in the ascending triangle’s example), and in some, it doesn’t. That’s the main reason for moving the stop loss at break-even if you decide to book only half of the profits at the measured move.
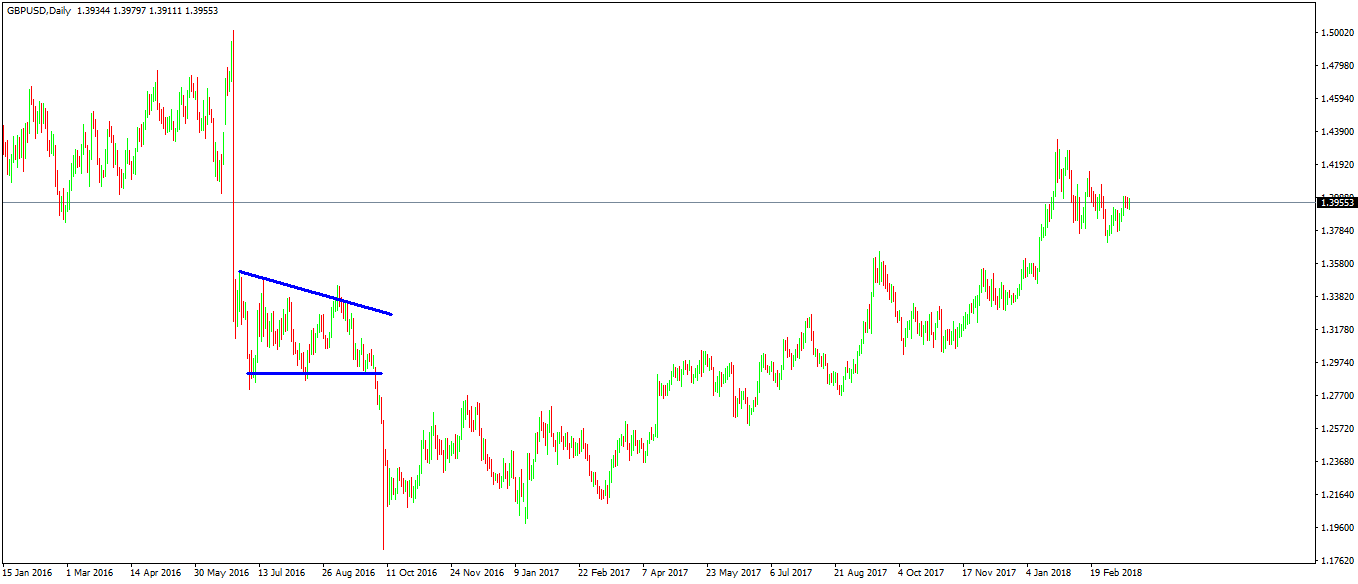
As it appears above, the GBPUSD reversed in a nasty rising channel, invalidating the previous bearish trend.
Most of the triangles that form in Forex trading don’t have a horizontal base. The Elliott Waves Theory integrates perfectly this characteristic.
According to Elliott, triangles have five segments, labeled with letters: a-b-c-d-e. The descending triangle from above would look like this under the Elliott Waves Theory:
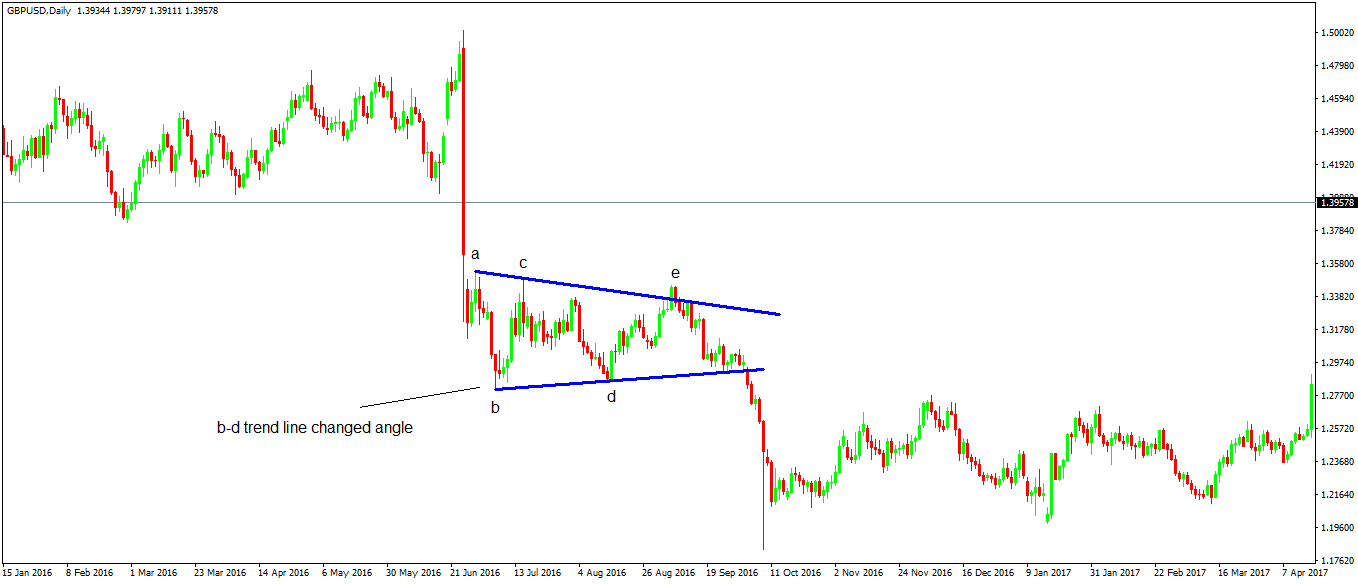
The focus shifts to the b-d trend line, which, by no means, is a horizontal line. It is just another interpretation of a triangular formation, destined to point out that triangles are an integral part of various trading concepts and strategies.
Conclusion
Ascending and descending triangles show consolidation before a major breakout. Some of them turn out to be traps, as the move that follows the breakout is quickly reversed.
Others see a strong trend after the breakout. In both cases, though, the measured move must come. If the price is not able to reach the levels resulted from the measured move, the ascending or descending triangle were not correctly interpreted. An error exists somewhere.
With this article, we end the pattern recognition approach in Forex trading. We covered the most powerful patterns, and the way traders use them to make a profit.
Next, we’ll focus on a few fundamental aspects to complement the technical analysis, before moving to the Japanese candlesticks techniques.