
Triangles as a Reversal Pattern
Despite not appearing in its title, this article is about the Elliott Waves Theory as it is the only one to incorporate triangles as reversal patterns. Because triangles form so often and appear on every timeframe, from smaller ones to bigger ones, they have a special place in the Elliott Waves Theory.
Elliott understood a triangle’s role like no other. He established clear rules for interpreting a triangle so that there’s no misunderstanding:
- A triangle has five legs. No more, no less.
- All segments have corrective activity
- The labeling of a triangle is a-b-c-d-e
- The a-c and b-d trend lines will show the type of triangle
The rules stood the test of time. In new markets, such as Forex trading, the same rules apply to the same patterns. Hence, triangles are universal technical analysis patterns that fit every market and chart.
Elliott divided the moves a market makes in two: corrective and impulsive waves. If one is not impulsive, it MUST be corrective.
In other words, it isn’t necessary to check both impulsive and corrective conditions on the same market segment. Instead, only try to prove one. If it works, then that’s clear. If the segment doesn’t respect them, you can draw the other conclusion.
The entire trading theory uses this logical process. In fact, it is one of the Elliott theory’s great features.
Triangles in Forex Trading with Elliott Theory
Part of the three simple corrections found by Elliott, a triangle is by far the most common one. It appears all the time.
But simple corrections don’t form that often. Instead, financial markets like to consolidate most of the time.
Elliott’s solution to this problem was to divide corrective waves further, into simple and complex corrections.
A complex correction has a minimum of two simple ones, and a maximum of three. Before going into more detail, let’s remember what the three simple corrections are:
- Flat
- Zigzag
- Triangle
As we mentioned, a complex correction has a minimum of two simple corrections. Just pick two of the three above, and you will have a complex correction.
For example, a flat and a triangle. When the market forms a flat pattern, and then a triangle, that’s a complex correction.
However, they can’t form without something in-between. The need for an intervening wave, or a connecting one, became obvious. Something to link the two!
Elliott’s solution was the x-wave. An x-wave, therefore, connects simple corrections. Hence, there’s no complex correction without at least one x-wave.
Coming back to the example used earlier, if a complex correction has a flat and a triangle, the correct Elliott labeling is a-b-c – x – a-b-c-d-e. Or, flat – x-wave – triangle.
X-waves in Forex trading are:
- Simple or complex corrections
- Connecting two, or a maximum of three simple corrections
When the x-wave connects two corrections, the market forms a double combination pattern. Naturally, when a complex correction has three simple ones, the need for two x-waves appears. That’s when the market forms a triple combination, and the labeling of it is:
a-b-c – x – a-b-c – x – a-b-c-d-e.
Complex corrections never start with a triangle. But almost always end with one. And this brings us to this article’s subject…
Because complex corrections are more common than simple ones, and because complex corrections almost always end with a triangle, a triangle acts more like a reversal pattern rather than a continuation one.
Therefore, the most common complex correction to find in Forex trading is a double combination. It can either start with a flat or a zigzag, but most of the time will end with a triangle.

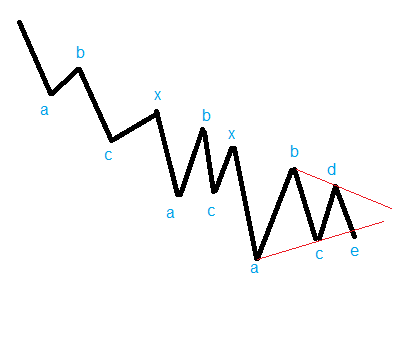
A closer look at the pattern above tells us that this is a complex correction. First, based on the fact that there are only letters, we know the labeling illustrates a corrective move.
Second, the presence of an x-wave tells us the correction is a complex one. Third, the presence of the letters ‘a’ and ‘e’ tells us a triangle exists.
Finally, based on the first b-wave’s retracement (less than 61.8% of the previous wave a), we know the complex correction begins with a zigzag.
Hence, we have two simple corrections (a zigzag and a triangle) and an intervening x-wave. That’s a double combination, and when the price breaks the b-d trendline, the reversal already took place.

How about this ugly pattern? Is there a way to make sense of it?
According to Elliott, there is. This is a triple combination, and the proper labeling of it is shown in the image below.
Now it makes more sense, as Elliott traders see the presence of the two x-waves that define the triple combination. As a rule of thumb, any triple combination ends with a triangle. Moreover, that triangle acts as a reversal pattern.
Real life Forex trading counting isn’t that easy though. The theory is one thing, the reality another.
Forex trading and charting is known for its wild swings, and putting an order in all the market moves, like Elliott Theory claims to do, is a daring task.
Think of the labeling or counting process as a big puzzle to solve. If a single piece is missing, the job is incomplete. Hence, the trade or the forecast is inaccurate.
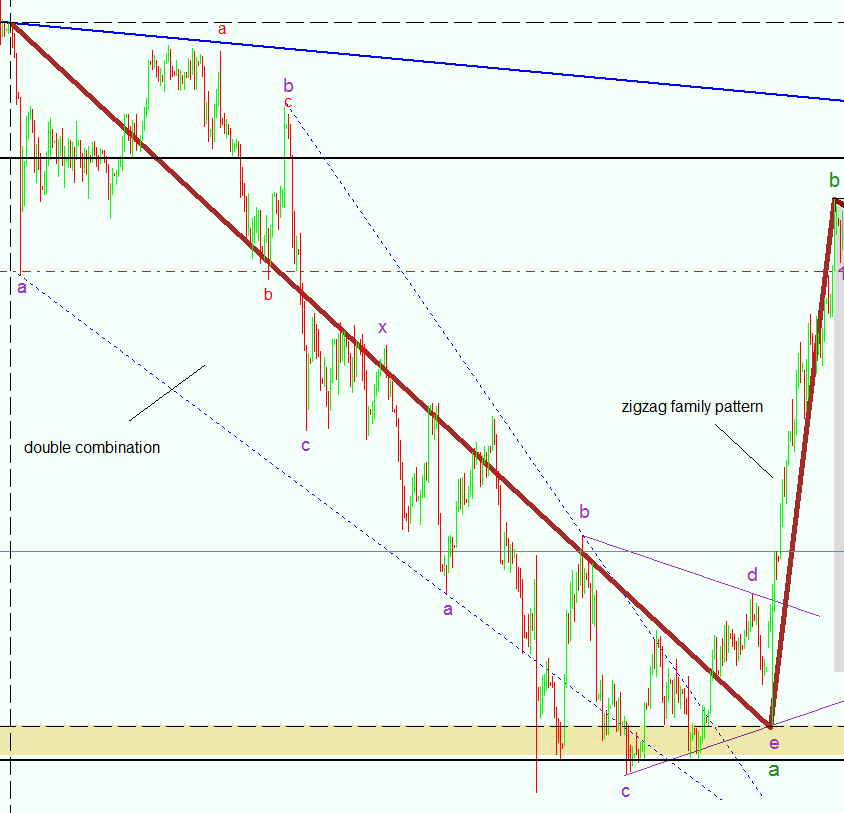
Here’s an Elliott Waves count in Forex trading. From left to right, the market formed an a-b-c in purple. A flat pattern, if we judge by the b-wave’s retracement over the 61.8% of wave ‘a’.
A small consolidation started next. Judging by the number of segments (five), it looks like a triangle for the x-wave. Remember that all x-wave are corrective waves, so in this case, the intervening x-wave is a triangle as a simple correction.
But the market kept on falling after the x-wave. It formed a triangle in the c-e baseline (more on this in future articles in this Trading Academy section), and then the price broke higher.
From the moment the b-d trend line broke, the triangle ended. The presence of the x-wave tells us the triangle is at the end of a double combination that started with a flat and ended with a triangle as a reversal pattern.
Elliott further differentiates between different types of double combinations, in an attempt to forecast the next market move based on the previous one. After all, this is what technical analysis does: uses information from the left side of a chart to predict future price action.
However, now is not the time nor the place to go into more details. What matters here is that Elliott saw triangles differently than all other technicians of his time.
While most used triangles as continuation patterns (ascending or descending ones), Elliott found them mostly as reversal patterns.
Conclusion
Patterns in Forex trading are complicated enough to scare traders using complex trading theories like the Elliott Waves Theory. However, it is a rewarding process if done correctly.
Triangles as reversal patterns are one of the most powerful, yet easy to trade patterns. Some traders simply wait for a market’s consolidation and draw a potential trendline to check the break.
When the break comes, they go long or short at the b-d trendline, place a stop loss at he lowest point in the triangle formation, and target a meaningful risk-reward ratio (1:3).
But the rules of a triangle were best laid down by Elliott. Therefore, a sound understanding of the patterns they are a part of is mandatory.