

The Most Popular Oscillators: Standard Interpretation
Oscillators have fascinated traders since the personal computer became available. The possibility of computing complex formulas in Forex trading led to traders searching for the perfect setup.
In sharp contrast to trend indicators, most oscillators were created to spot potential fake moves the price makes. Even though there are similarities between how a trend indicator and an oscillator are calculated, traders use them in different ways.
A trend indicator, as the previous article in our Trading Academy revealed, considers multiple periods before plotting a value under or below the current price. So does the oscillator.
Traders use trend indicators to define a bullish or bearish market. They buy dips in bullish trends and sell spikes in bearish ones. Moreover, almost all trend indicators appear on the main chart of a trading platform.
Oscillators paint a different picture. First, the data shown by oscillators appears in a separate window, at the bottom of a chart. Secondly, oscillators come with an “in-built” definition or setup that differs from one to another.
In the case of trend indicators, the idea is to spot the trend and ride it. From a strategic point of view trend indicators act as continuation patterns.
With oscillators, traders mostly look for market reversals. Therefore, we can safely state that oscillators serve traders to spot potential reversals.
Because of that, the standard interpretation of an oscillator is the same: shows overbought and oversold levels. As such, traders buy dips in oversold levels and sell spikes in overbought territory.
However, such a strategy mostly works with ranging markets. Which is ok, as Forex trading mostly shows consolidation areas. And some currency pairs even range more than others.
But when trending conditions exist, overbought and oversold levels don’t help anymore. For this reason, traders came up with another concept: divergences.
A divergence appears when the price shows one thing, but the oscillator fails to confirm that move. What move to trust? The oscillator’s of course.
Divergences and overbought and oversold levels are the two primary uses of an oscillator. Interestingly enough is the fact that some oscillators show trending conditions, but only temporary.
Famous Oscillators in Forex Trading
Before discussing the main oscillators in Forex trading, there is one thing to know. Most of them, if not all of them, were created before retail Forex trading existed.
Or, before retail traders had access to the interbank market. However, because it is a mathematical formula that merely plots levels, it has tremendous use in Forex trading too.
Relative Strength Index (RSI)
Any discussion about oscillators must start with the RSI. It is so famous, every trader has heard of it and looked at it at least one time in his/her career.
The default period is 14, meaning the RSI will consider the previous 14 candlesticks before plotting a value on any candlestick chart.
The RSI travels only in positive territory. It has values between zero and one hundred, even though extreme levels beyond 80 or below 20 rarely appear.
Because of that, the standard interpretation uses the 70 and 30 levels as overbought and oversold levels respectively. However, keep in mind that a market may end up staying in overbought and oversold levels more than a trader remains solvent. That’s why the concept of a divergence appeared.
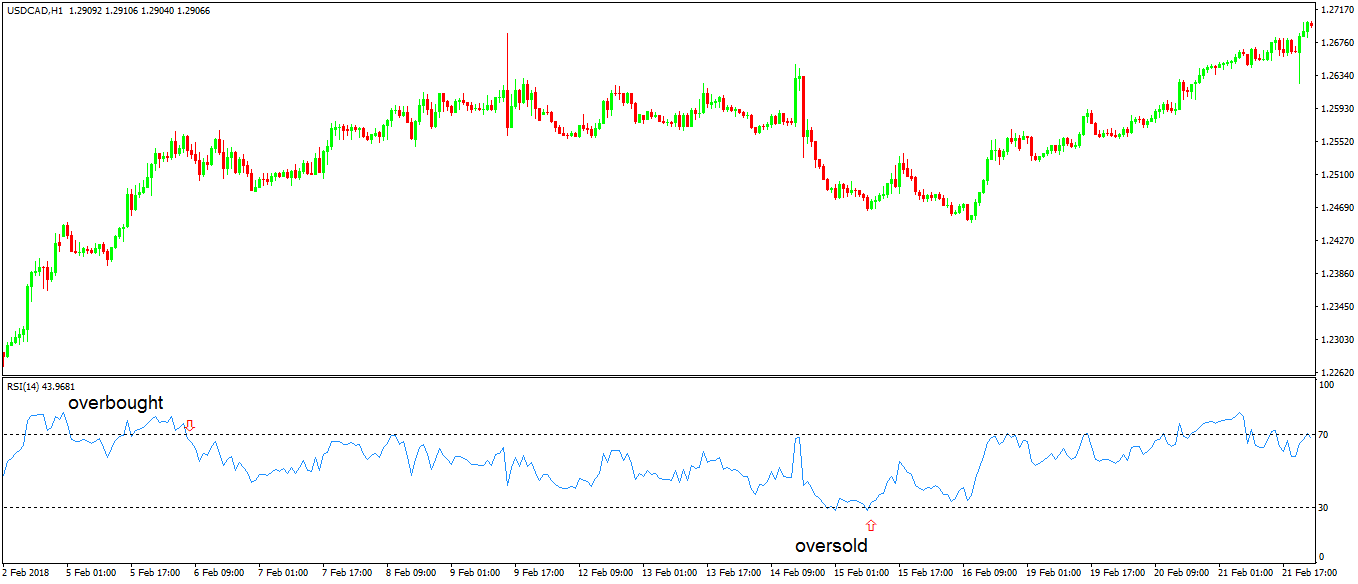
Here’s a basic RSI interpretation on the USDCAD recent hourly chart. Selling above 70 and buying below 30 seems to work rather okay, but not all the time.
Starting from left to right, selling overbought sees only the price surging. Only when the RSI makes the second and the third attempt, the market dips a bit.
Scaling (dividing the entry into multiple small positions to find a better average) helps when in situations like this. A forex trader knows overbought and oversold levels require a great deal of position management.
Otherwise, if all you must do is to buy oversold and sell overbought, everyone would make money. However, that’s not the case in Forex trading.
Divergences help traders pick tops and bottoms. When a currency pair’s price diverges from its oscillators, traders stick with the oscillator’s moves.
The reason is a simple one. Because the oscillator considers multiple periods over the current price, it offers more reliable information.
Typically, a divergence appears when the price makes two higher highs, but the oscillator fails to make the second high. Or, in a bearish trend, the price makes two lower lows, and the oscillator doesn’t confirm the second one. Just like the chart below shows.
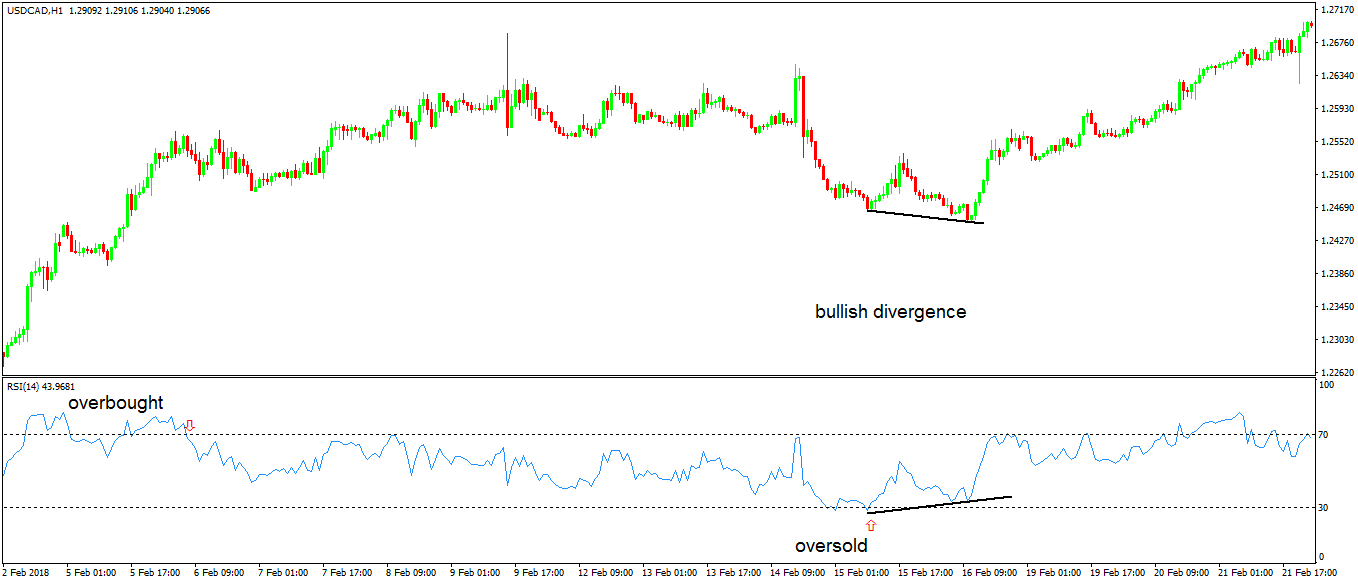
The price made two consecutive lows, but the oscillator didn’t. Remember that traders stick with the oscillator’s move, so the second decline in prices proves fake. A bullish divergence formed, in oversold territory, and that’s a significant buying signal.
Commodity Channel Index (CCI)
While still an oscillator, the CCI differs from the RSI as it follows the price action closely. The default setting again comes with the 14 period, but if you check the chart below, it shows far more trips in overbought and oversold levels.
For the CCI, overbought and oversold levels have different values. More precisely, -100 and +100. Hence, the CCI travels both in the positive and negative territory. The only difference is that it moves more often.
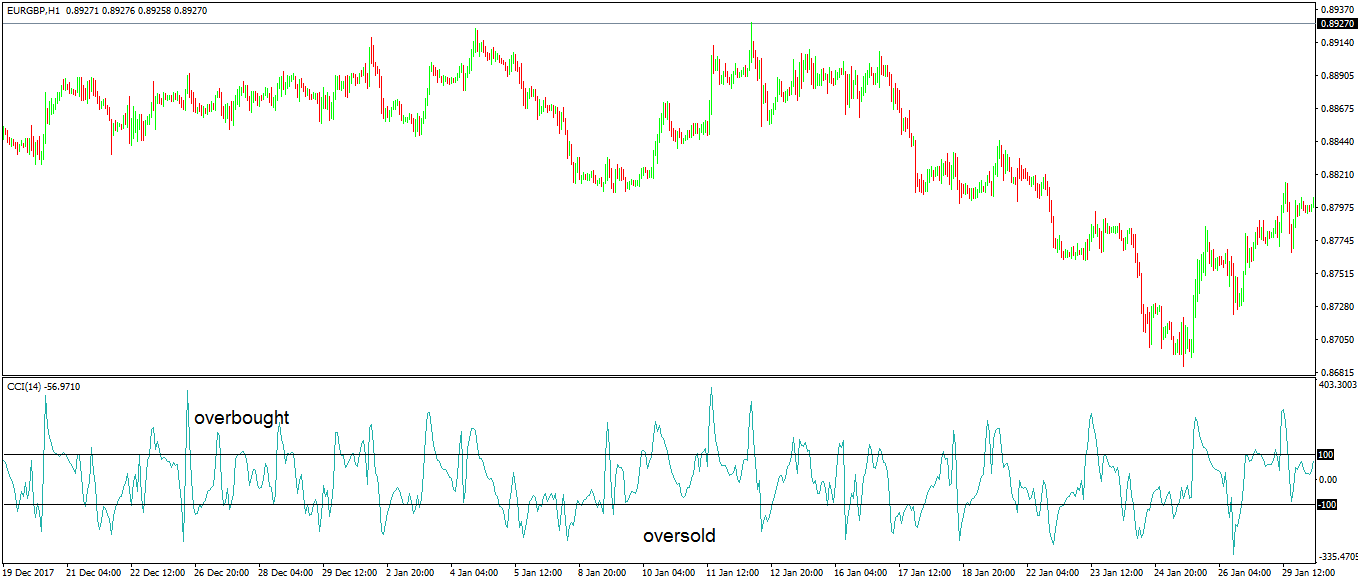
Even the smallest change in price makes the CCI reaching extreme levels. In trading sessions like the Asian ones, known for low volatility, the CCI easily reaches overbought or oversold levels, while the RSI won’t. It is just a matter of the mathematical formula involved in calculating the oscillator’s values.
How about divergence? Do they work with the CCI? To some extent, they do work in Forex trading.

The chart above shows a bearish divergence. Now that you know to spot a divergence, I’m sure you can easily locate new ones on this chart.
But, divergences with the CCI aren’t that reliable like the ones offered by the RSI. Because the CCI travels so often to extreme levels, divergences turn out to be fake.
Instead, many traders use the CCI zero level as a continuation pattern. Namely, they pay attention when it breaks above or below the zero line and open a position in the same direction.
Moving Average Convergence Divergence (MACD)
The MACD appears on this list because trading Forex with it requires simple rules to follow. Moreover, there are no overbought or oversold levels with the MACD.

The grey area on the MACD represents its histogram. The moment it travels above zero, a bullish market starts.
When it dips below zero, a bearish one appears. As simple as that.
Of course, there would be fake signals. But, when searching for a long trend, that’s the best place to start.
Depending on the settings, the MACD shows two lines, with one of them, called the signal line. When it crosses the main one (the red one on the chart above), traders sell, and they buy when opposite conditions appear.
Conclusion
Oscillators do have their utility in Forex trading. They keep traders on the right side of the market.
Imagine you spot an RSI divergence on the monthly chart of a currency pair? Or the daily one?
It doesn’t mean that the market will reverse suddenly, but it represents a warning for savvy traders. They immediately start deploying protective measures, like booking part of profits or even hedging (opening a trade in the opposite direction of the initial one or trading an inversely correlated currency pair) part of the position or squaring it entirely.
Besides the ones mentioned here, traders have access to numerous oscillators. Depending on the trading platform, the default settings come with a different set of oscillators.
However, traders do have the possibility to import any oscillator on any trading platform, opening endless possibilities in Forex trading.