
Discovering DeMark Indicators
A highly respected technical analyst Tom DeMark still provides consultancy to major investment houses. His work in the field of technical analysis is known by all traders involved in Forex trading.
Most of its indicators aren’t available for free. However, some are, and this article aims at showing traders how to use them in Forex trading.
Forex Trading with DeMarker Indicator
One indicator that is offered for free in the standard version of the MT4 platform is the DeMarker indicator. An oscillator, it appears at the bottom of the chart where it is placed.
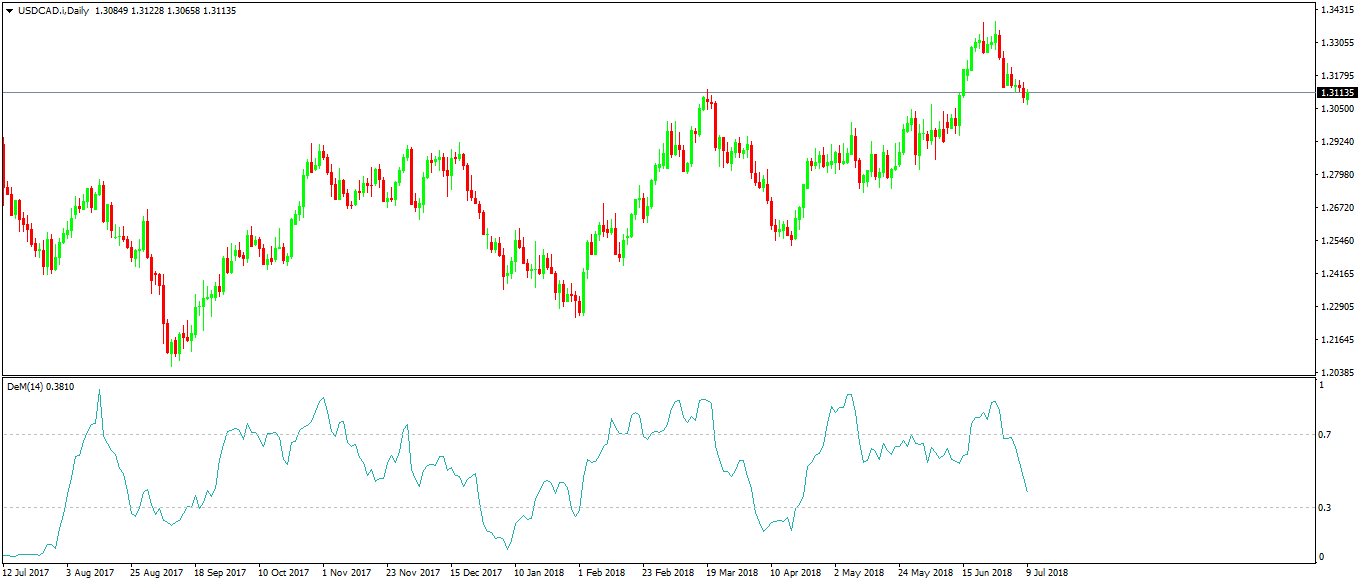
Here is the USDCAD daily chart having the DeMarker oscillator at the bottom.
It resembles the RSI (Relative Strength Index) as it travels only in positive territory. Even the trading strategies used in RSI trading work when trading with the DeMarker too.
While in the RSI case the overbought and oversold levels are 70 and 30, the DeMarker travels between 0.3 and 0.7. Moreover, instead of a maximum level of 100 as the RSI has, the DeMarker has 1 as the maximum level.
One distinction between the two is that the DeMarker reaches overbought and oversold levels faster than the RSI does. The easiest way to see that is to just place on the same chart both the RSI and the DeMarker and see which one reaches the overbought and oversold levels first. Obviously, keeping the same setups.
Speaking of the setups, the standard period with the DeMarker oscillator is 14, just like in the RSI’s case.
When using any oscillator that shows overbought and oversold levels, traders focus on buying oversold and selling overbought. This works extremely well in ranging conditions.
When the market is in a trend, or, more precisely, at the end of a trend, the oscillator tends to diverge from the price. Hence, traders use bullish and bearish divergences between the price and oscillator as a signal to buy or sell a currency pair.
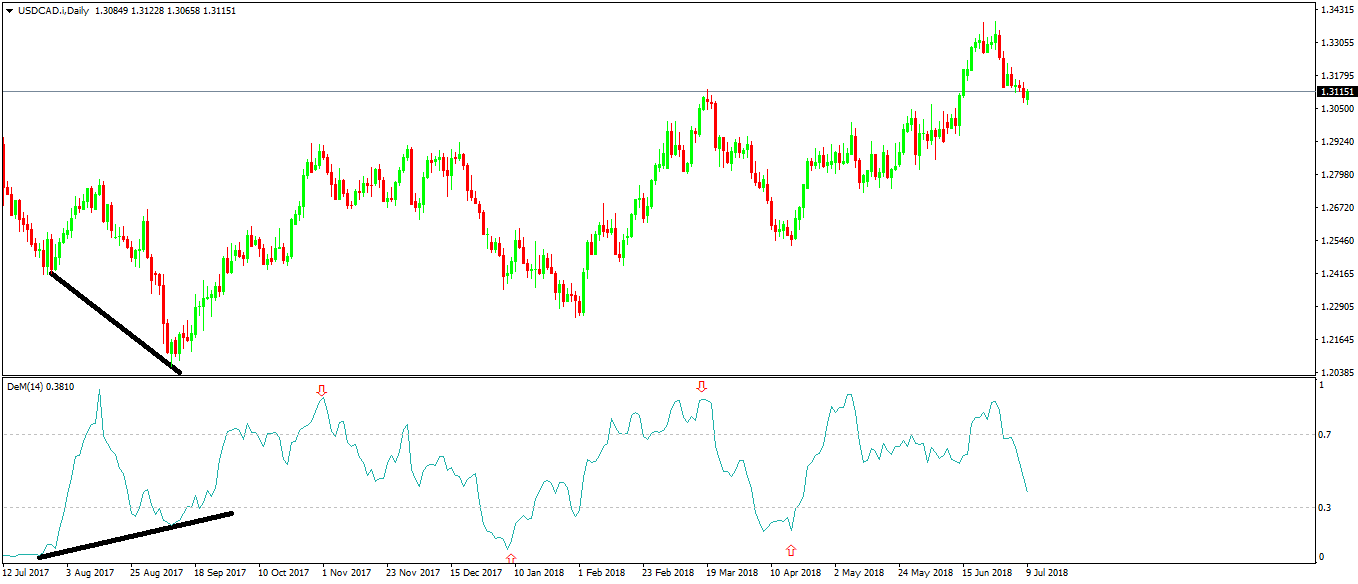
Above is the same USDCAD chart, only this time showing the two standard ways to use the DeMarker. From left to right, the oscillator shows a bullish divergence that gives the absolute bottom of the previous trend.
Further on the right side, the overbought and oversold levels give great entries on the short and long side respectively. However, if we are to continue the comparison with the RSI, here’s a tip when using the DeMarker this way: wait for “extreme” overbought and oversold levels before selling or buying a currency pair.
By extreme, we mean values much more significant than 0.7 and much lower than 0.3. Where the RSI finds it hard to reach the 80 or the 20 levels, the DeMarker easily exceeds 0.8 or 0.2.
Forex Trading with TD Sequential
An amazing indicator, the TD Sequential doesn’t come with the standard version of the MT4 platform. However, it isn’t something to dramatize, as a simple Internet search finds plenty of places to download it for free.
The TD Sequential or DeMark Sequential as it is also known, simply ads some numbers on a chart. More precisely, it ads numbers above and below the actual candles.
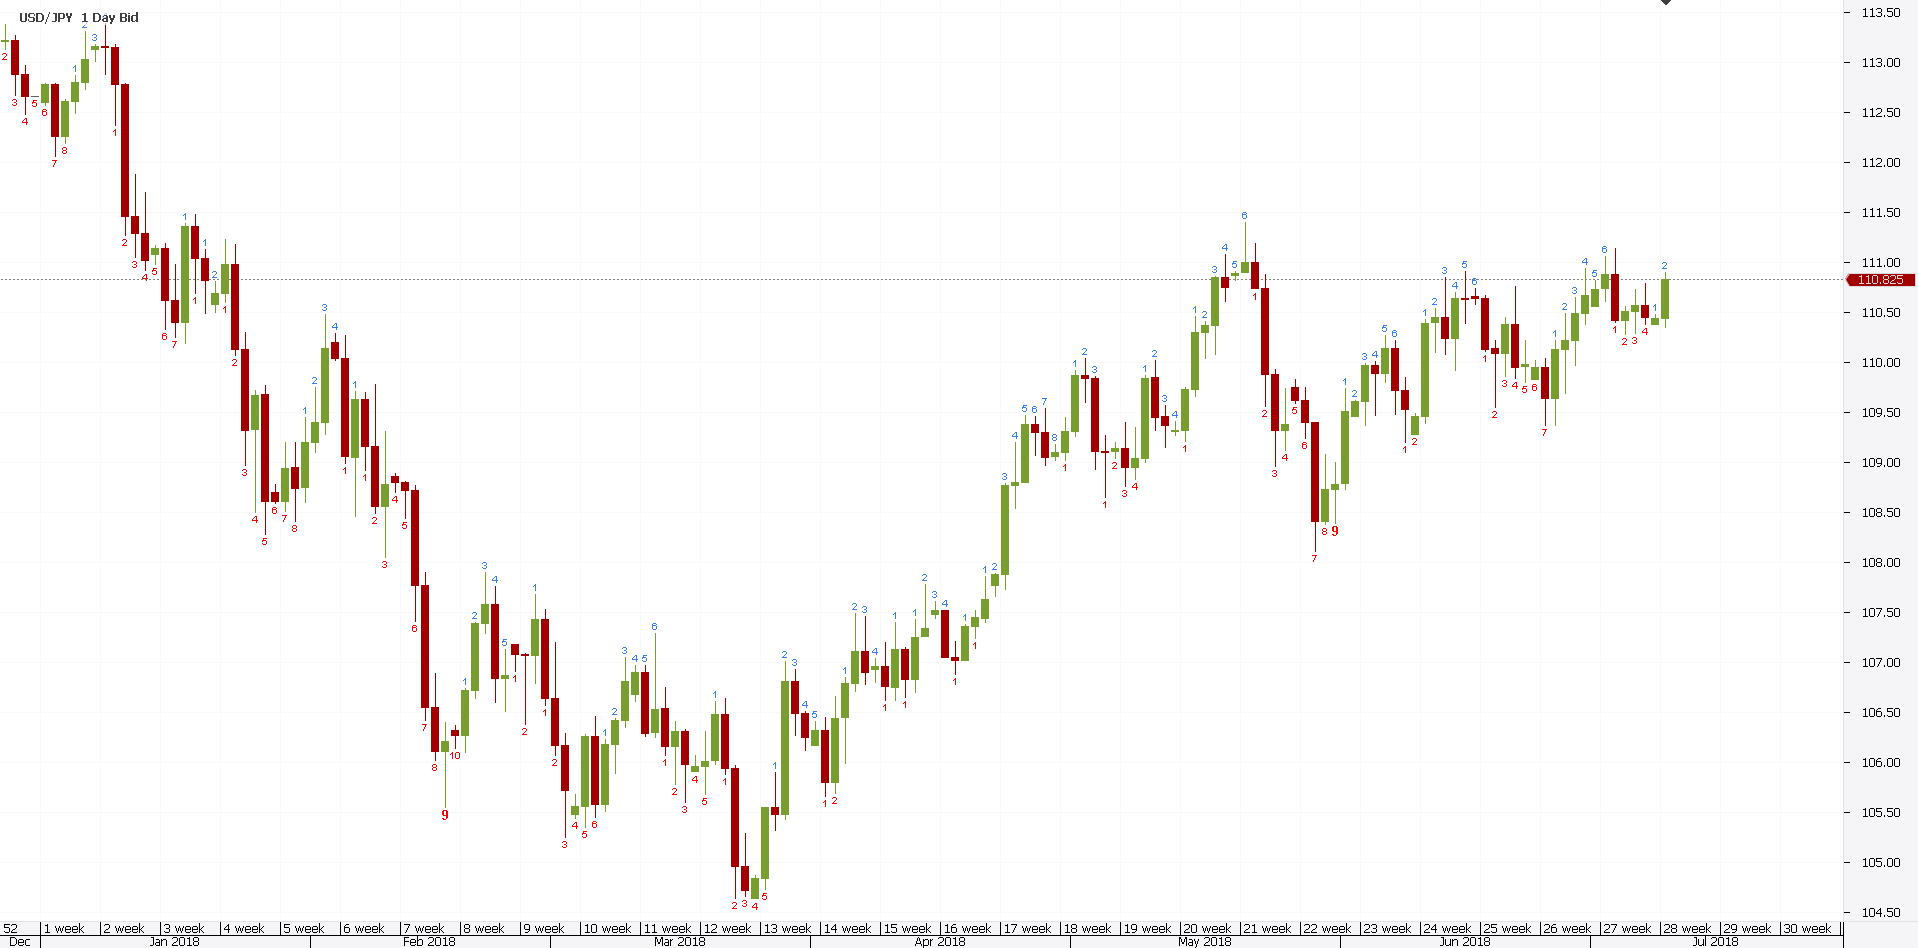
However, these aren’t just numbers. They represent a series of numbers, ascending or descending, that follow a specific logic.
The numbers below the candles show a bearish trend, while the ones that appear above illustrate a bullish trend.
The indicator plots a number above a candle if its close is bigger than the close of the candle four periods ahead.
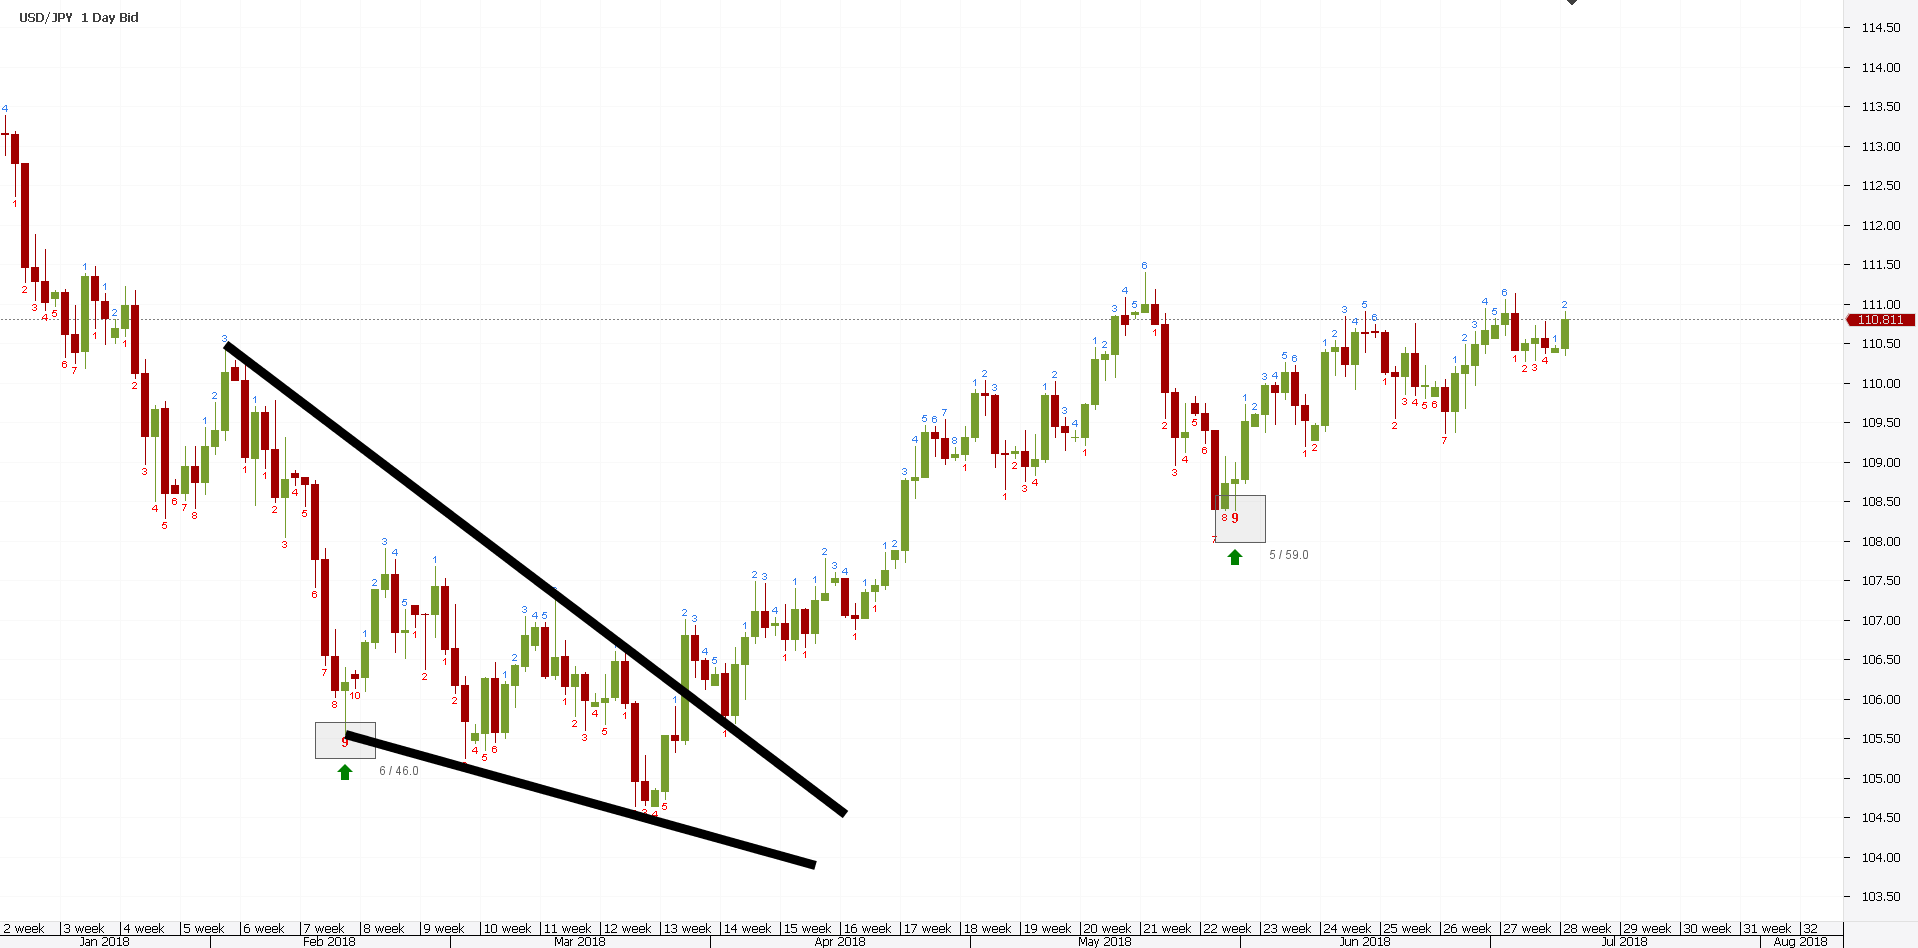
Using the chart above, a blue number means that candle closed higher than the candle four periods ago. Or, four days ago as this is the daily timeframe.
According to the TD Sequential indicator, the trend reaches exhaustion when the market forms nine consecutive candles that follow the above-mentioned rule. For this reason, the number nine is highlighted with bigger characters.
A close look at the chart above shows only two instances where the USDJPY daily chart shows the number nine. It means that since January 2018 until July 2018 (half a year), the TD Sequential gave two signals only, both of them bullish.
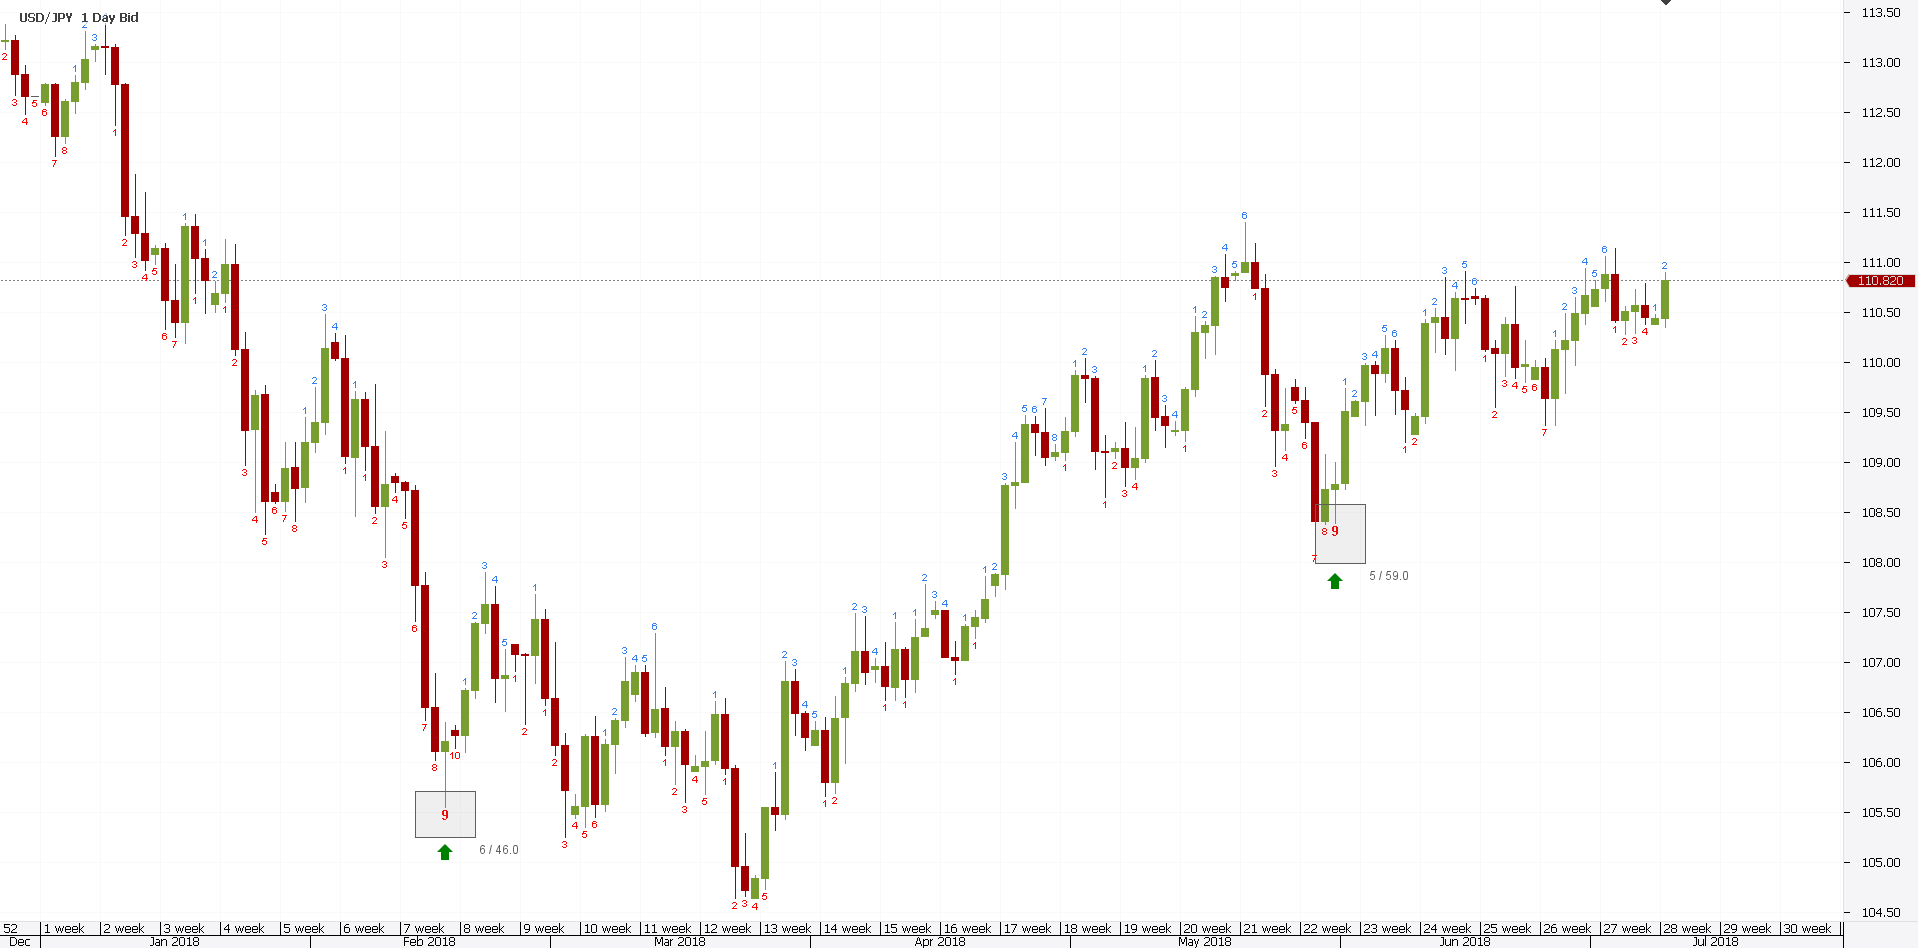
While the one on the right side of the chart almost picked the bottom of that pullback, the one on the left was followed by the market making two new lows.
This is one of the major risks when trading only with the TD Sequential. The market may continue the underlying trend.
Savvy traders, though, use it in conjunction with reversal patterns. Because the TD Sequential is, in fact, a reversal indicator, traders use it as a reinforcement when using other reversal patterns.
For instance, the first signal on the chart above comes at the end of a hammer. The hammer, as we already know, is a bullish reversal pattern. If using the rules of trading the hammer, the trader gets out for at least a 1:2 risk-reward ratio. At this point, please check the article dedicated to trading the hammer.
Moreover, while the market makes two new lows, it does that building a falling wedge pattern. Which, again, is another reversal pattern, this time a classic one, that comes to reinforce what the TD Sequential tries to say: the market is approaching a bottom.
As it becomes obvious, trading a reversal pattern that has a bullish or bearish TD Sequential signal increases the chances for the trade to succeed. In this falling wedge case, traders:
- wait for the upper trendline to break
- enter at the break or the retest - which in this case it came, and that’s a great entry on the long side
- place the stop loss at the lowest point of the wedge
For the full strategy on how to trade the falling wedge, now may be the right time to review the article in this Trading Academy dedicated to it. Just scroll through the articles in the Beginner section of this academy.
Conclusion
The two DeMarker indicators presented in this article are little known in the retail Forex trading world. That’s especially the case with the TD Sequential indicator.
As we have shown here, they are quite powerful and generate signals difficult to ignore. Some traders simply use the TDS as a trend indicator after the number 1 appears and they ride the trend until the number 9 signals exhaustion.
To sum up, the DeMarker indicators are excellent to use in Forex trading. When combined with other reversal patterns, other Japanese reversal ones or classic ones, they generate strong signals that increase the chances to make a profit in the currency market.