Description
In this video we will introduce technical analysis and examine the logic behind it and why it works. The key principles of technical analysis will be unveiled. Market action discounts everything, prices move in trends, and history repeats itself.Course Curriculum
In this video we will introduce technical analysis and examine the logic behind it and why it works. The key principles of technical analysis will be unveiled. Market action discounts everything, prices move in trends, and history repeats itself.
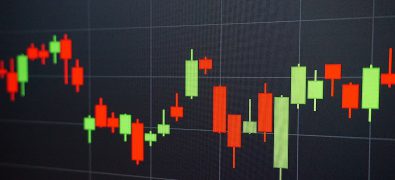
In this video we will go through the different ways to view price charts and their construction. Viewers will become familiar with reading different types of charts such as Line Charts, Bar Charts and Candlestick Charts, and how data and information is available to traders in the markets.
Viewers of this video will get the chance to learn about the Basic Bar formations which can be easily identified easily by the comparison of two consecutive bars, as well as the basic Candlestick Formations that can help traders identify trend continuations and reversals.
You’ve heard the phrase “Trend is your Friend”. During this video we will identify key components which make a “good friends”. It is a must for beginners and a good revision for seasoned traders. We will focus on trend identification which is the best way to make money in the markets.
Since, technical analysis is built on the assumption that prices trend, we will discuss how to draw trendlines directly on charts and use a variety of different technical tools to assist them in identifying strong trending markets.
In this video we will introduce supports and resistances levels as we examine the various chart points and facets that can act as such. We will go through several ways of establishing supports and resistances.
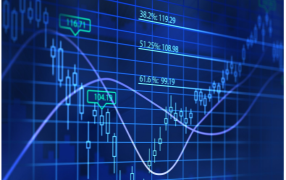
Another technique of finding possible support and resistance levels is through Fibonacci Levels. Viewers of this video will see how Fibonacci retracements can be used in the identification of key levels with high probability.
Since the ability to spot an upcoming trend reversal is a huge advantage to trading the markets. In this video we will go through the major trend reversal patterns that have been identified throughout history in the markets. Such as Head and Shoulder, Double and triple tops and bottoms…
Continuation patterns indicate a temporary pause in the trend, where prices consolidate before resuming in the same direction. Thus, patterns like Triangles, Wedges, Pennants, Flags and rectangles provide traders with renewed opportunities to enter the markets.
The moving average is a trend following indicator that helps smooth price action and filters out the noise. But what are the different types of moving averages? How can they be calculated? And how their signals can be interpreted? We will find out in this video, and we will also take a deep look to the MACD indicator.
In this video you will learn the theory and construction mechanisms of Momentum Oscillators, your best ally in sideways market movements. Of course, their use is not limited to range trading but extends to trending markets as well.
Oscillators’ signals can be interpreted in three discrete dimensions. In this video you will have the chance to look at the direction of the oscillator, the area in which it fluctuates and different types of Divergences.
Volatility measures the size and frequency of changes in the price of a security, and hence shows how much risky trading in that security is. Viewers of this video will have the chance to take a deep look into the most commonly used tool that measures volatility such as the Standard deviation, the Moving Average Envelopes, the Bollinger Bands and the ATR.
Viewers of this video will enhance their understanding by adding one key indicator to their search for information from the markets, The Average Directional Index that helps not only in identifying whether the market is trending or not, but also determining the strength of the trend.
In this video the Japanese trading wisdom also known as Ichimoku Kinko Hyo, will be explained and demystified. That versatile indicator defines supports and resistances, identifies trend direction, reflects momentum and provides trading signals.
Viewers of this video will get the chance to learn about one of a clutch of trading techniques, the Parabolic SAR is a complete trading system that is easy to follow and provides more discipline to the trader.
In this video we will explain alternative methods of charting prices that can provide a different insight into monitoring price movements. We will go through Heikin-Ashi, Renko and equivolume charts as well as an introduction to point and figure charting techniques.
Ratings
42 Ratings
Detailed Ratings
| 5 Stars | 86% | |
| 4 Stars | 14% | |
| 3 Stars | 0% | |
| 2 Stars | 0% | |
| 1 Stars | 0% |