
The Beauty of Chinkou
One of the most mysterious indicators in Forex trading and technical analysis, in general, is the Ichimoku Kinko Hyo. We already dedicated a couple of articles to this fantastic indicator, and this one comes to complete the series.
It would come handy at this moment if you check the previous articles as they explain what the Ichimoku stands for. Here’s a quick review:
- it acts both as a trend indicator and an oscillator
- it shows a state of equilibrium between future and past prices
- projects future support and resistance levels way before they form
The Ichimoku indicator has the following elements:
-Senkou A and Senkou B lines
- these two lines give the cloud, or the Kumo, as it is also known
- when Senkou A crosses above Senkou B, the cloud is bullish, and traders will look to buy into future support
- when Senkou A crosses below Senkou B, the cloud becomes bearish, and traders look to sell into future resistance
- Kinjun and Tenkan
- resembling two moving averages, these two lines show the trending conditions of the Ichimoku
- traders use them the same way as using Moving Averages in trending markets
- Chinkou
Mostly misunderstood by so many traders, the Chinkou line has fantastic properties. For this reason, it deserves an entire article explaining how to look at a chart via the Chinkou’s perspective.
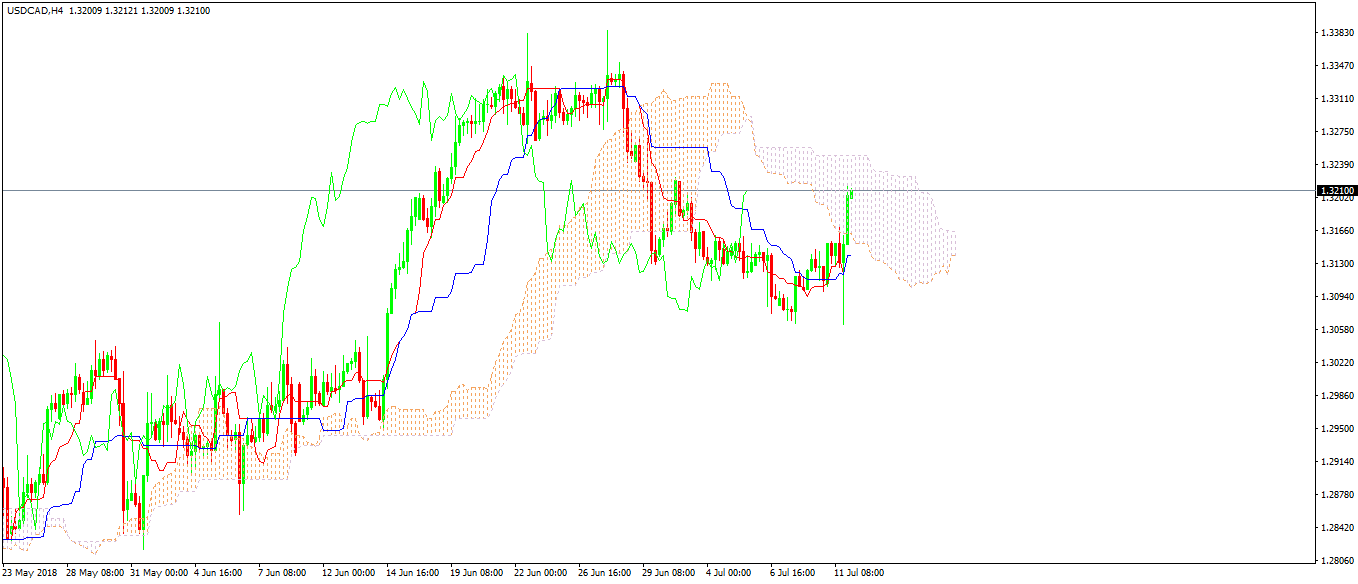
Before anything else though, traders must be sure they know where to look for the Chinkou. Unfortunately, the MT4 platform comes with terrible colors in the default setting of the Ichimoku indicator.
See the chart below? Guess which line is the Chinkou: the green one! Hence, quite difficult to analyze and interpret.
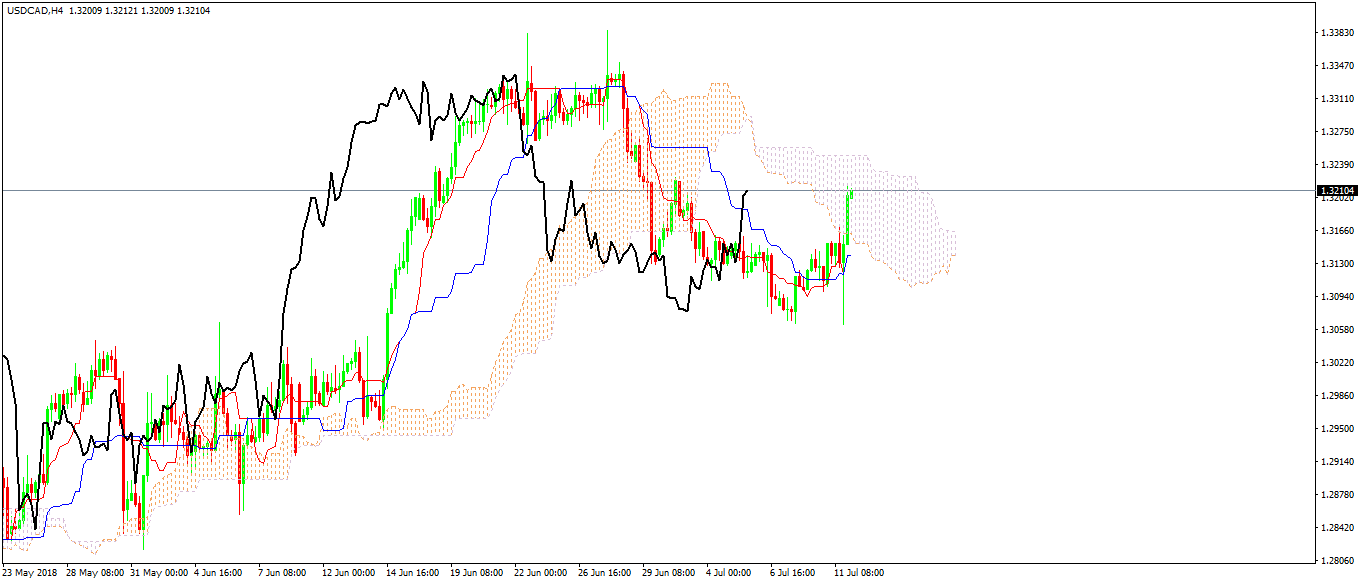
Fortunately, that’s easy to fix. Here’s a better chart showing the Chinkou in black and having a more visible line:
Interpreting the Chinkou Line
The reason why we use a current price is to show the state of equilibrium as the Ichimoku indicator reveals. Look at where the price is on this daily USDCAD chart and check the left and the right side of it.
On the right, there is the cloud or Kumo. Currently, under a bearish setting, the cloud is supposed to offer resistance to future prices.
It is projected on the right side of the current price by twenty-six periods. Or, in this case, twenty-six days.
On the left of the current price, there’s the Chinkou. It shows the same level as the current price only projected twenty-six periods in the past. Or, twenty-six days earlier.
Therefore, the current price sits in an equilibrium stance between the Chinkou and the extreme levels of the cloud.
This is important, especially when back-testing a strategy based on the Ichimoku indicator. At any time, the trader must focus on three variables:
- the candlestick in question (the equivalent of the current price)
- the Chinkou level twenty-six periods ahead
- and the extreme levels of the cloud
Only then, the interpretation of the Ichimoku makes sense.
Also, note that the Chinkou mimics the price’s moves. However, the Chinkou line only shows the distance traveled by the real body of the actual candle.
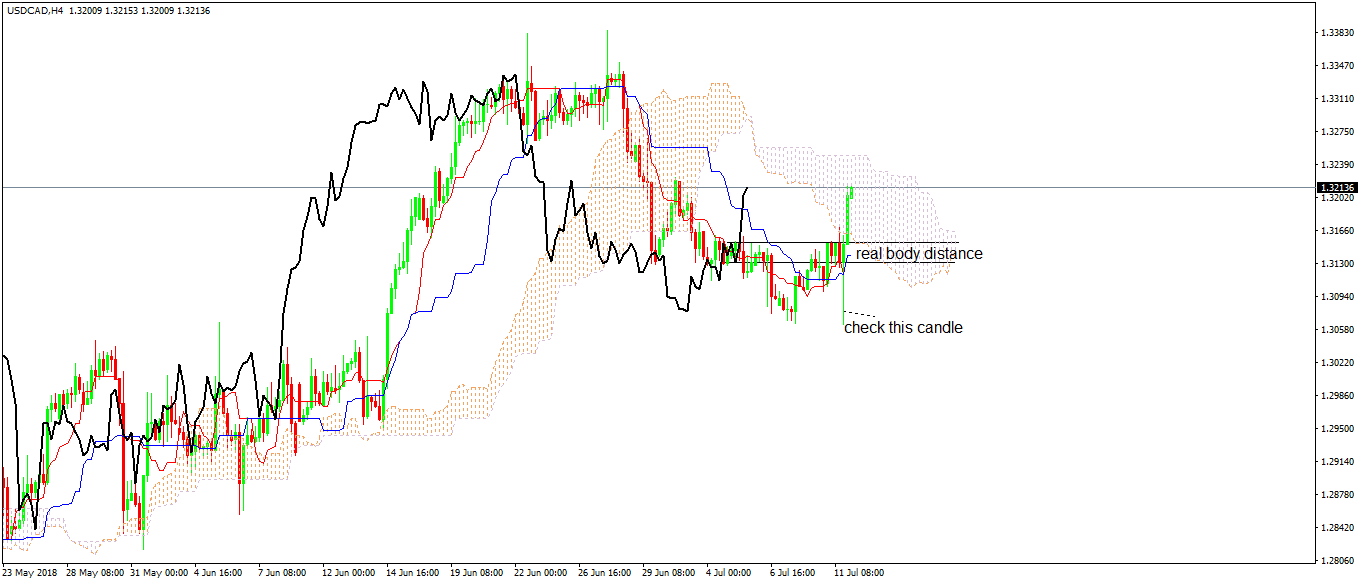
Let’s have a look at the chart above. The candle indicated, while having a long lower shadow, has a relatively small real body in comparison.
As a reminder, the real body shows the difference between the opening and closing prices in a candlestick. When positive, it has the green color, while a negative one projects a red-colored body.
While the actual candlestick does show the lowest level reached by the price, the Chinkou only traces the real body. Even though at one time during the candlestick’s formation, the Chinkou was showing that level!
In other words, for the Chinkou all that matter are the opening and closing prices.
Avoiding Prices
The Chinkou’s main characteristic is that it avoids the prices. More precisely, it avoids the candles in front of it.
Because of that, it is used by traders as both a trend indicator and one that shows strong dynamic support and resistance levels.
In trending conditions, the Chinkou will always be above or below the actual candlesticks. Keep in mind that because the Chinkou line is projected twenty-six periods ahead, there will always be candles below or above it.
The rule says that:
- in a bullish trend, the Chinkou is always above the candlesticks
- a bearish trend is in place when the Chinkou sits below the candlesticks
Also, for trending conditions to exist, the Chinkou needs to keep a distance before the candlesticks in front of it. The more the gap shrinks, the weaker the trend becomes.
In other words, if the Chinkou has the power to approach the candlesticks, the trending conditions weaken.
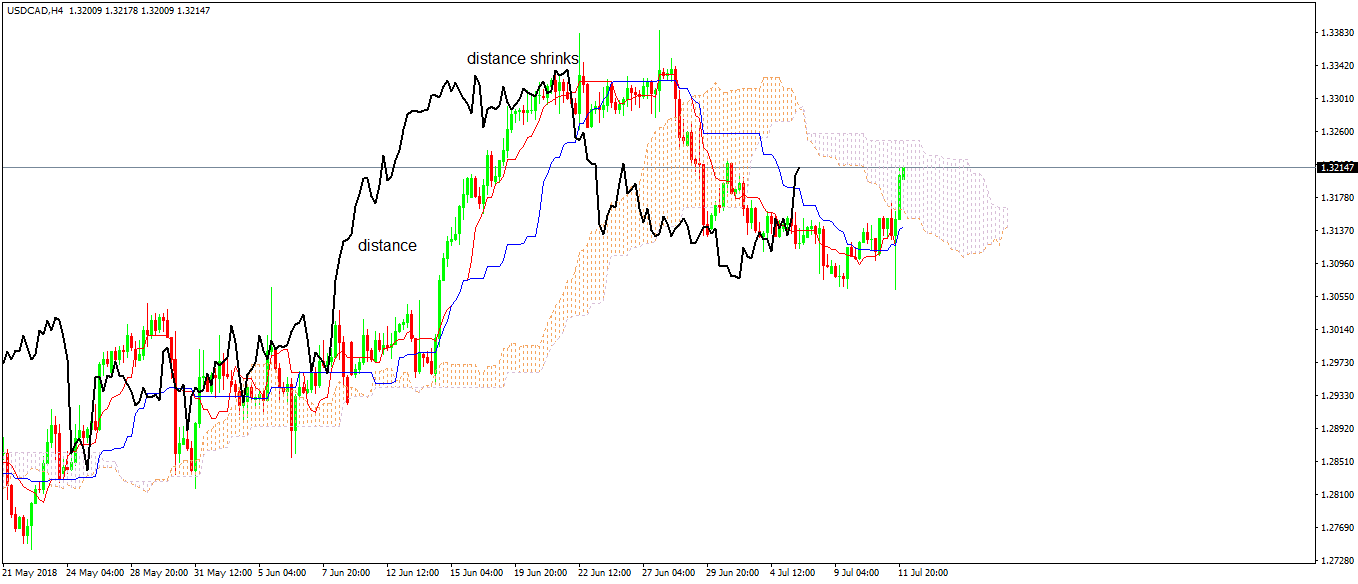
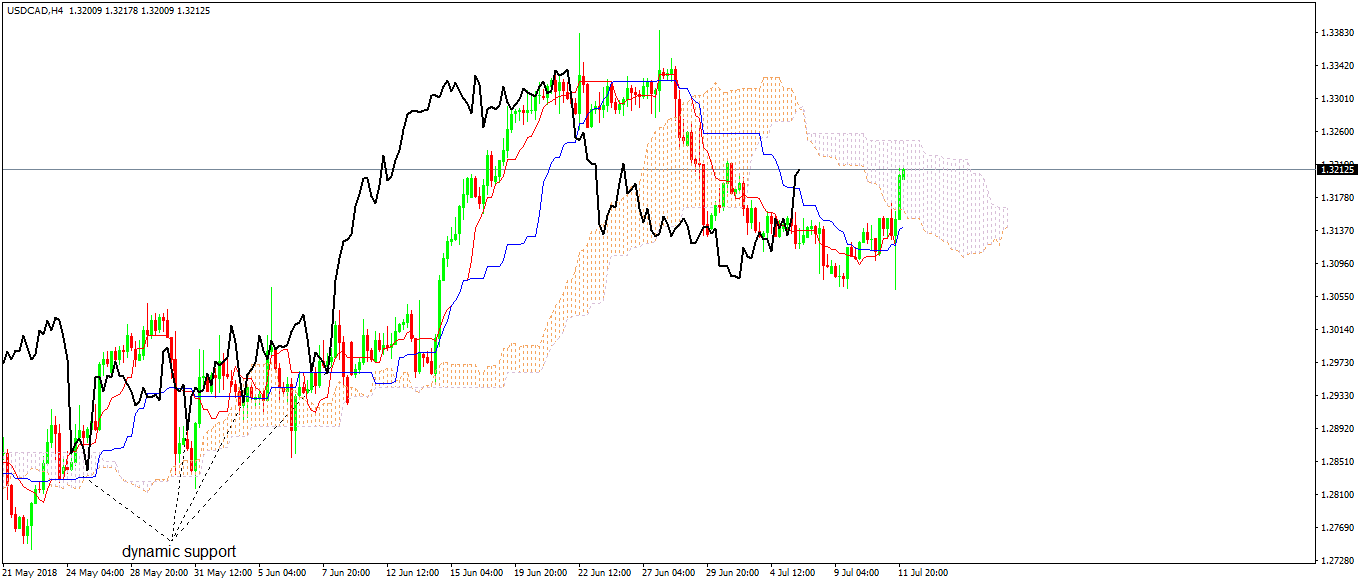
Let’s have a look at the same USDCAD daily chart. See that bullish trend?
For as long as it held, the Chinkou kept a reasonable distance from the candlesticks. However, the moment that the distance shrank, the bullish conditions disappeared, the trend weakened, and bears eventually overcame the bulls.
Chinkou as Dynamic Support and Resistance
As mentioned earlier, Chinkou also acts as a great indicator of dynamic support and resistance levels. The idea is the same, as it uses the other elements of the Ichimoku indicator as support or resistance.
In the USDCAD example, right on the left of the chart, the Chinkou finds tremendous support on every dip. Hence, the current price finds support and traders used the dynamic levels as great places to add on the long side.
The more elements of the Ichimoku indicator come in front of the Chinkou, the stronger the support or resistance level becomes. Moreover, the bigger the timeframe, the stronger the level.
Conclusion
Trading with the Ichimoku indicator gives a bit of everything to the savvy trader. It offers future support and resistance levels, but also past ones.
This article comes to complete the ways of trading with the Ichimoku indicator. All the trading strategies showed so far are best when used together.
In fact, many traders use only the Ichimoku indicator as it gives a full view of the current, past and future market conditions. This, combined with fundamental analysis and news interpretation, offers a complete picture of what’s happening every day on the currency market.
Together with the Japanese candlesticks patterns, the Ichimoku indicator brought a new approach to technical analysis the Western world didn’t know it existed. Many are still surprised by the natural and straightforward interpretation it brings to Forex trading.