
Explaining the Perfect Contracting Triangle
If there is one pattern that illustrates most consolidations, it’s a triangle. Two types of triangles dominate Forex trading: contracting and expanding.
Out of the two, expanding triangles need special conditions to form. Every leg of an expanding triangle (Elliott identified five segment parts of a triangle) breaks the previous swing’s high or low.
In other words, it makes a difficult Forex trading environment, as traders see their stops tripped often. It feels like the “market goes after the stops” only to reverse rapidly.
Fortunately, expanding triangles rarely form. This is especially true in Forex trading due to the market’s high volatility levels.
But contracting triangles do form. Elliott identified many types of contracting triangles, all following the basic rules:
- a contracting triangle has five legs
- all of them are corrective, not impulsive
- triangles are labeled with letters, not numbers (a-b-c-d-e)
- because all waves show corrective activity, the triangle is called a “three” structure, despite, in fact, having five waves
- the a-c and b-d trendlines show the nature of the triangle
- the b-d trendline is more important; a break of it shows the triangle’s end
- both simple and complex corrections of a lower degree may form as a leg of a contracting triangle
- elongated patterns (elongated flats or zigzags) have the tendency to appear as the entire leg or part of a leg of a contracting triangle
- the e-wave of a contracting triangle tends to be a triangle on its own
- the price action in a triangular formation typically breaks the a-c trendline
Sounds complicated? Well, it may seem that way, but it is only normal to have so many rules, due to the triangle’s variations.
Contracting triangles may be:
- horizontal
- symmetrical
- irregular
- ascending
- descending
- running variations
Moreover, special types of contracting triangles exist too, like:
- triangles with c-e baseline
- triangles with a-e baseline
The Perfect Contracting Triangle
When a market (currency pairs) consolidates, it forms a triangle. At least, that’s the tendency. Hence, traders that understand triangular formations have a competitive advantage when approaching Forex trading.
The perfect contracting triangle is called a limiting triangle. The name comes from the expected market reaction after the triangle breaks.
Such a triangle:
- is clean, meaning the b-d and a-c trend lines aren’t pierced by any price action during the triangular formation
- has a measured move
- uses the apex as projected support and resistance level
- limits the price of the primary trend
Out of the above, the last one is the most important one. No matter how violent the breakout is, in the end, the price has a limited potential.
For this reason, we can say that limiting triangles are, in fact, reversal patterns, despite the breakout coming in the direction of the underlying trend.
Here’s what to expect after a limiting triangle:
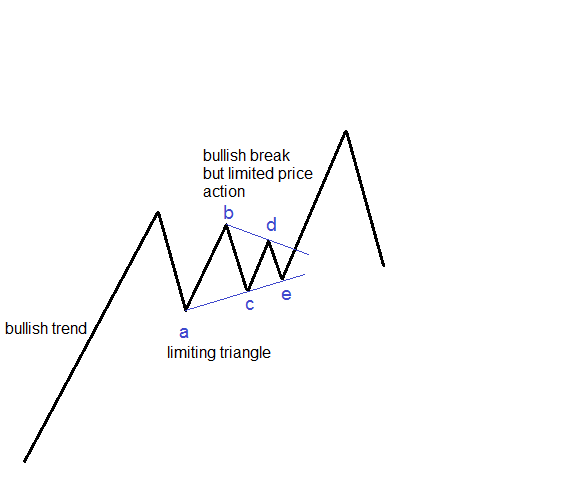
The market pauses a strong bullish trend. Next, it forms a five-segment structure. Or, a triangle.
While the breakout that follows is still bullish, in the direction of the underlying trend, the price action that follows is limited. Eventually, the market reverses.
Interpreting the Apex of a Contracting Triangle
The apex of a triangle plays a crucial role in trading the price action that follows a limiting triangle. Effectively, the market will reverse to the apex, and the level serves as a strong horizontal support or resistance level.
It is quite interesting how the price action unfolds based on what a previous pattern shows. But what is the apex of a triangle?
The contracting nature of a triangle is given by the two trendlines: a-c and b-d. More precisely, they “contract” until, eventually, they’ll meet.
The meeting or cross point is the apex. Hence, to find it, traders project the two trendlines on the right side of the chart until they intersect.
At that cross, they draw a horizontal line depicting the strong support or resistance level. The market will find it difficult to break the apex’s level on the first attempt.
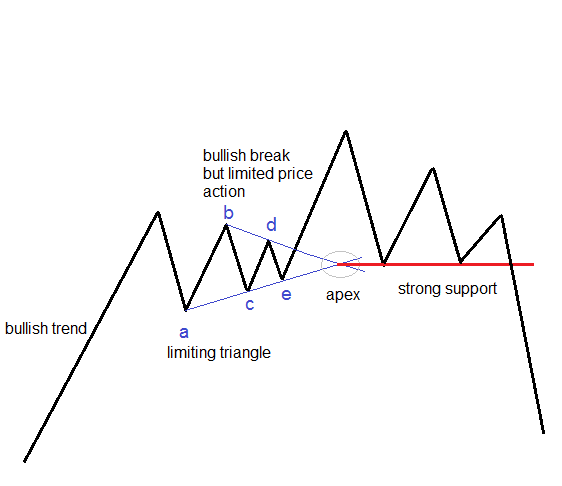
A quick look at the overall price action that follows the limiting triangle tells us that, in fact, it is a reversal pattern. While the price finds it challenging to break the apex on its first attempt, it will break it eventually. The more it tests the level, the weaker the bounces will become, until the price drops below the apex.
Why is this a perfect triangle? One of the reasons comes from the apex: not all contracting triangles have the apex close to the triangular formation.
Sometimes the b-d and a-c trendlines are almost parallel, making it impossible to project the apex. But this triangle projects future levels so accurately that it is one of the most powerful Elliott tools to use in Forex trading.
Naturally, limiting triangles do not appear often. But when they do, they offer traders a roadmap for a future price action.
USDJPY Example
Theory without examples is just that: theory. Traders need the practice to see the implications of Elliott patterns in technical analysis.
Here’s the USDJPY daily timeframe, showing a bullish trend. In the second part of 2014, the market rose in a strong bullish trend.
Suddenly, it stopped. A two-month-long consolidation started.
During that time, savvy traders new what the market was forming. And, more importantly, what to do after the pattern breaks.
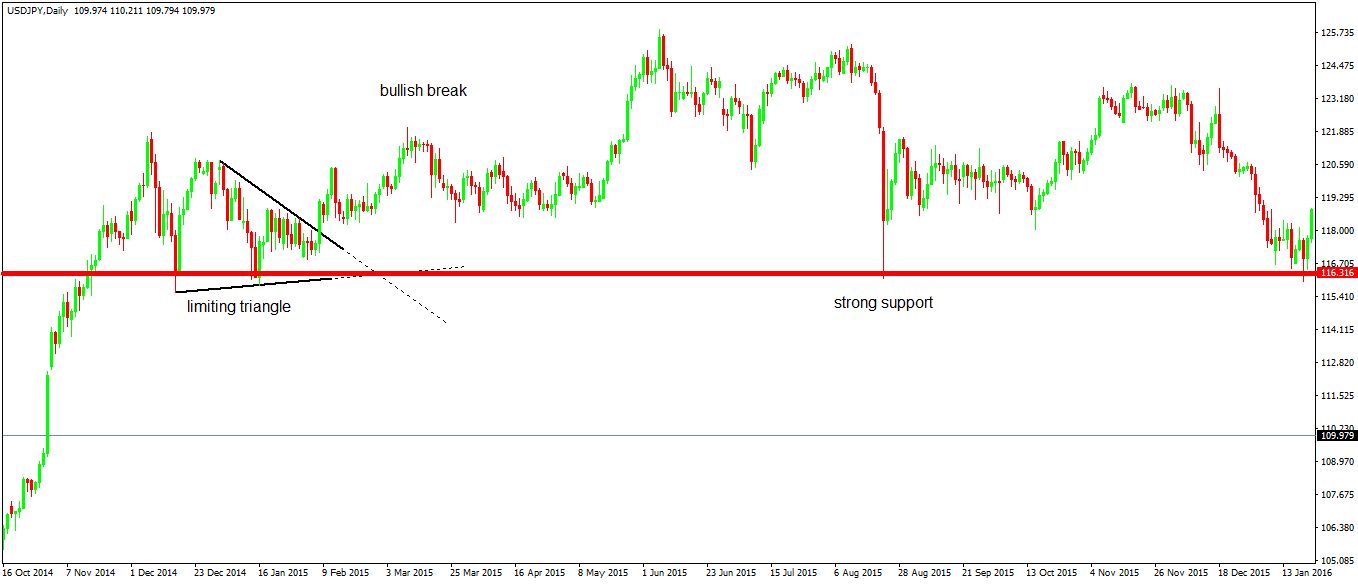
The triangle is evident. While the break higher drew even more bulls on the long side, the nature of this triangle shows limited upside potential.
In fact, traders that understand the implications of such a triangle know that it shows bearish conditions. Hence, it is a pattern that reverses the trend. The bullish one, in this case.
The red line shows the apex or the intersection point. It helps in projecting a future support level for interpreting the price action after the triangle breaks.
Months later, the famous August 2015 U.S. stock market flash-crash happened. As the JPY is strongly correlated with the U.S. stock market (investors use the low-interest JPY to borrow when investing in U.S. stocks), the JPY pairs react immediately to any sensitive move in the stock market.
Needless to say, the flash-crash caused the USDJPY drop to the apex’s point of that previous triangle. If anything, traders knew that’s a level from where the market is expected to bounce. But, a level that, eventually, will be taken out by bears.
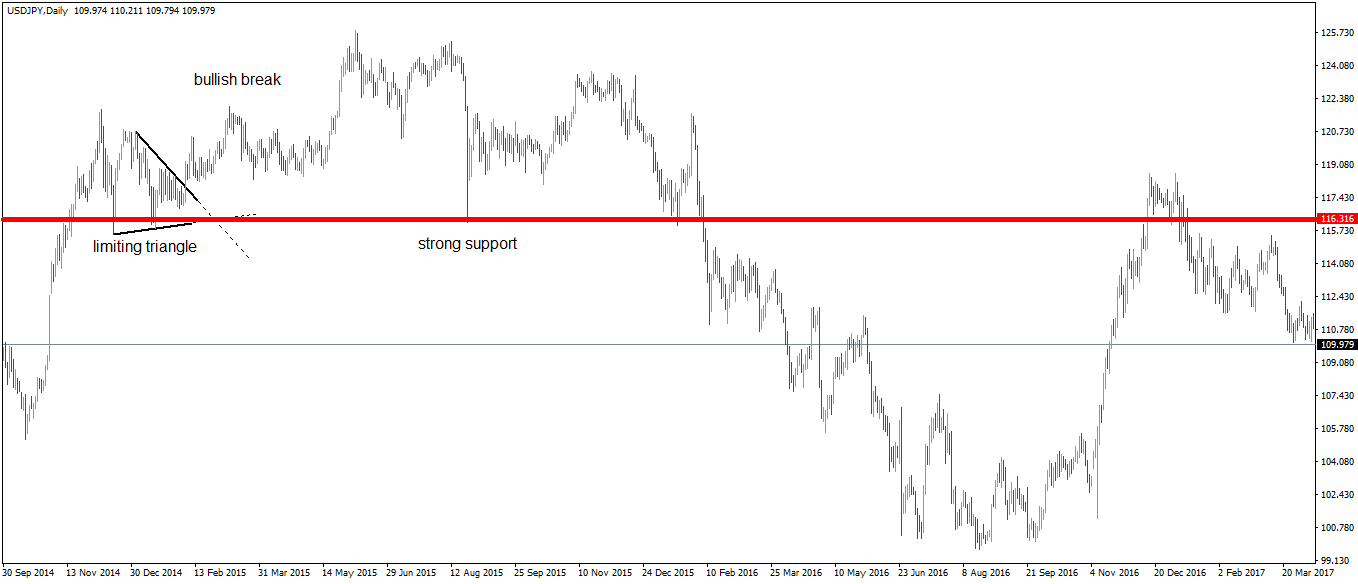
And, it was. The bounce came, and for a few months, the bulls tried to push higher.
However, the price failed to make new highs. Instead, the price action confirmed the growing bearish sentiment: it formed a series of lower-highs, the first sign of a bearish trend.
Conclusion
A limiting triangle is a complex pattern. So complex that it doesn’t form often.
The implications, though, make it worth waiting and searching for it. It provides a priceless roadmap for the currency pair it forms on.
Moreover, the timeframe is relevant too. The USDJPY example used in this article shows a triangle on the daily timeframe.
It is virtually impossible not to spot it. Limiting triangles are visible to the trained eye, and a big timeframe offers enough time to spot it.
To sum up, a limiting triangle is the perfect Elliott structure. It is his masterpiece and works wonders in Forex trading, despite being a pattern discovered on the stock market.