

Pattern Recognition in Forex Trading: Wedges
As reversal patterns, wedges form at the end of a trend. The price makes a series of higher highs or lower lows, before reversing.
If no direction exists, the wedge shape is just a fake pattern. Wedges appear to reverse the trend.
However, they come with a clear advantage when compared with the head and shoulders pattern. They take far less time to form.
To top it off, the risk taken is smaller too. The invalidation of a wedge, or the stop loss needed for a trade, is lower than the one required when trading the head and shoulders pattern.
Wedges come in two types: rising and falling. A rule of thumb says that a falling wedge is rising, and a rising wedge is falling.
In fact, it means that a rising wedge forms at the end of a bullish trend. And, from the moment the market breaks it, the bullish trend has ended.
On the other hand, a falling wedge shows bullish conditions. It implies that the bearish trend will end by the moment the price breaks the wedge.
In Forex trading, wedges appear often. Just open any currency pair and any timeframe to see them forming constantly.
The reason for that comes from their shape. The market tries to push more, but the price barely advances. It shows signs of exhaustion. And, eventually, it will reverse the course.
Fortunately, there are clear rules on how to trade a wedge. The pattern provides the entry, stop loss and a take profit that, most of the time, fulfills the minimum 1:2 risk-reward ratio necessary in Forex trading.
Basics of Rising and Falling Wedges
As mentioned earlier, a wedge shows exhaustion at the end of a trend. After a bullish trend, a rising wedge forms. And, after a bearish trend, falling wedges appear.
The image below shows a representation of a rising and falling wedge. The two trend lines define the shape of the wedge, and they also give hints about how to trade them.
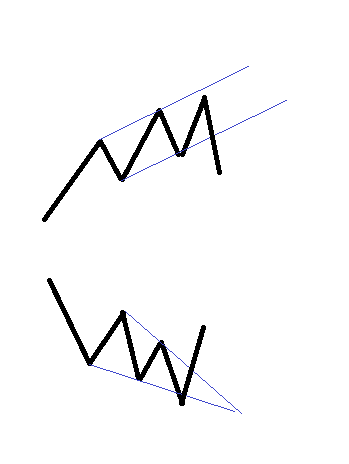
As you can see, the main characteristic of a wedge is the hesitation. The currency pair pushes higher (in a rising wedge), only to see a pullback coming shortly.
Next, another attempt to resume the trend, but bears fight back. Finally, bulls give another shot, before the pattern breaks.
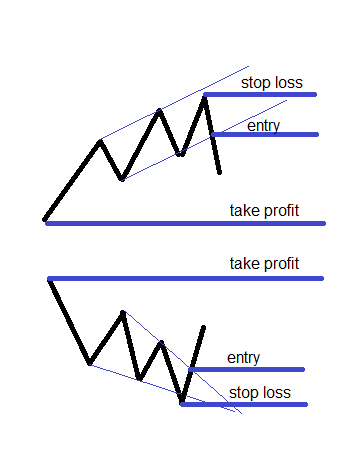
In a wedge, the focus sits with the lower trend line (in a rising wedge) or the upper one (in a falling wedge). That’s the entry for any given trade.
The highest or the lowest point in the wedge formation represents the stop loss. And, the full wedge retracement is the target.
Typically, that’s more than enough for a 1:2 risk reward ratio. Sometimes, it leads to much higher rewards when compared with the risk involved.
The bigger the time frame, the stronger the outcome. Only the time the market takes to consolidate, differs.
Examples of Wedges in Forex Trading
Wedges form often. So often, that in some cases they represent the only trading tool in a trader’s arsenal.
It makes sense! Think of how many currency pairs exist today in Forex trading and how many time frames, and you’ll get the picture.
Here are two examples of the most popular currency pair: the EURUSD. To illustrate their frequency and appearance on all time frames, we will look at the hourly and monthly time frames to build our case.
The first example shows a falling wedge on the hourly EURUSD chart. It formed recently, at the start of March 2018, and illustrates how to use a wedge formation in Forex trading, respecting the principles listed earlier.
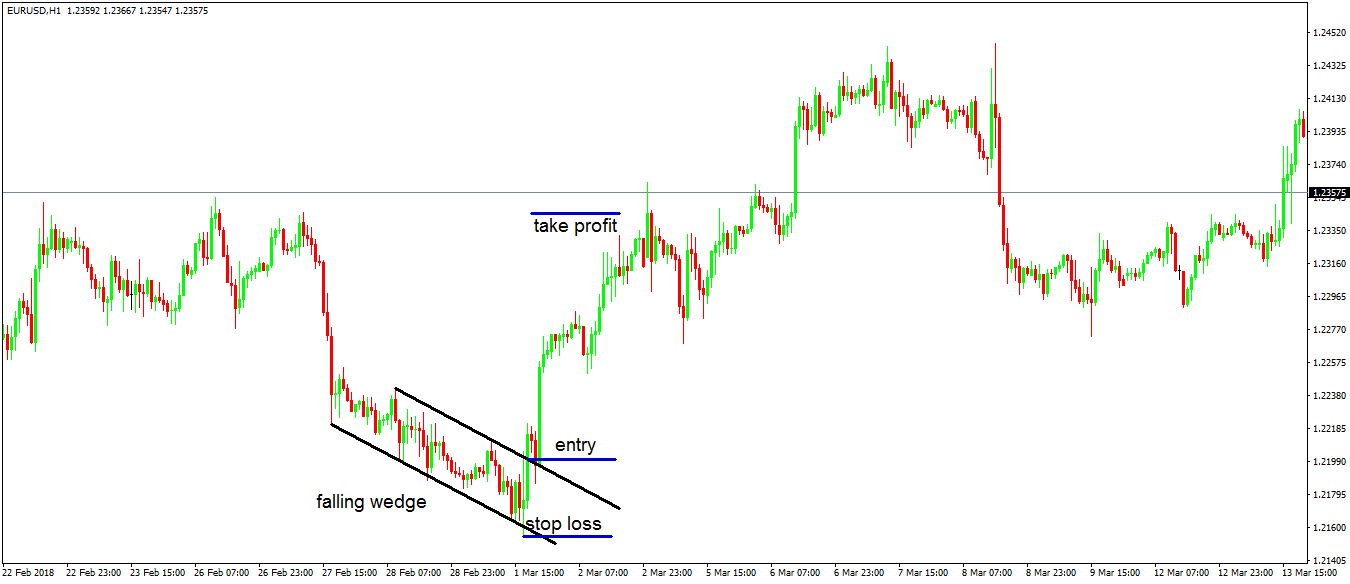
The pair dipped, forming a robust and violent move. However, the bulls kept pushing and pushing after each new low.
Eventually, the upper side of the wedge broke. That’s the entry place.
As mentioned earlier, the lowest point is the stop loss, while the take profit comes when the wedge is entirely reversed. How about that for a trade?
They form on the bigger time frames too. Here’s the monthly EURUSD one, with a wedge that took a couple of years to form.
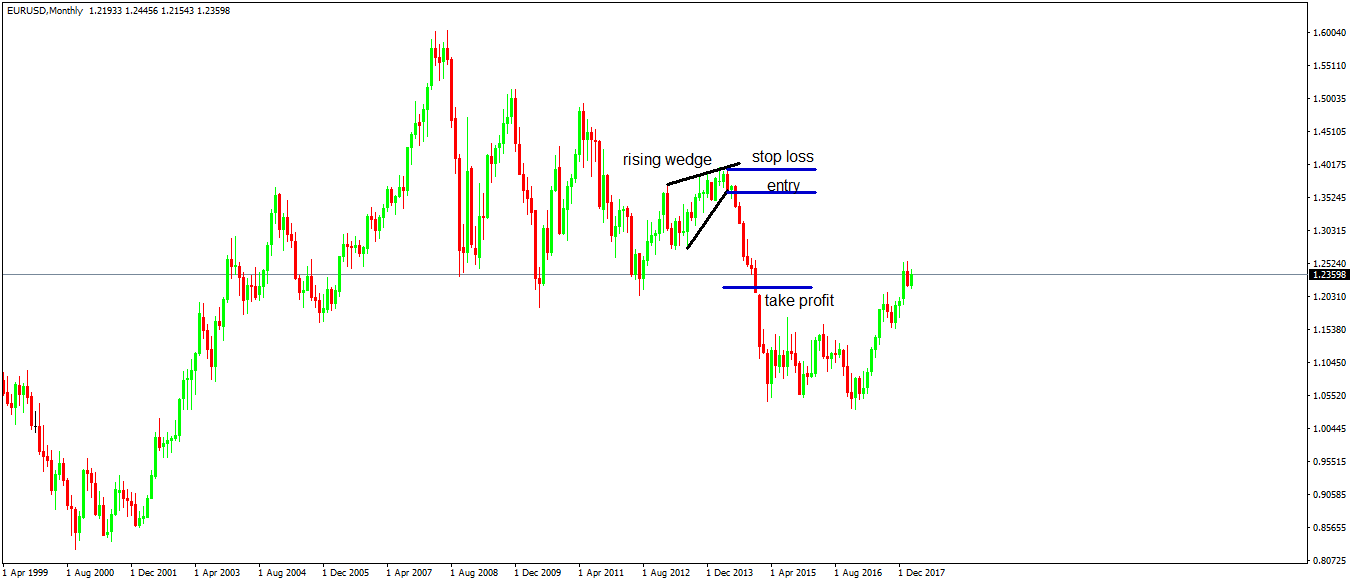
But the principle remains the same. The entry level, the stop loss and take profit respect the same rules, with the only difference coming from the distance the price travels to reverse the entire wedge.
Because of the clear rules of trade patterns like these, traders love wedges. In Forex trading, they form more often than other classic patterns and take less time to break.
Wedges Integration with the Elliott Waves Theory
Perhaps the one that took wedge interpretation to extremes was Ralph N. Elliott. As the founder of the Elliott Waves Theory, Elliott believed the market moves because of human behavior, or inputs.
Fear and greed govern our day to day lives, so they must reign over our trading decisions. With that in mind, Elliott divided the moves a market makes into cycles and a cycle into impulsive and corrective waves.
At the end of an impulsive wave, Elliott found that the market forms so-called terminal patterns. Those are wedges!
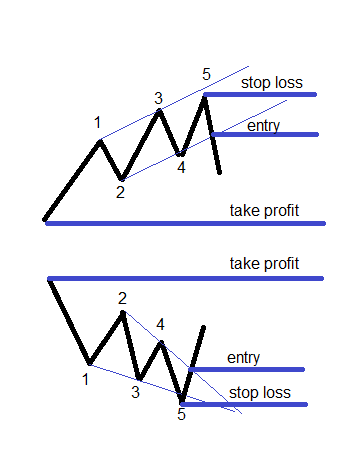
To put clarity in his analysis, Elliott used numbers to count an impulsive wave. Hence, the waves of a wedge follow the 1-2-3-4-5 count.
Now, the break of the wedge means the 2-4 trend line breaks. It makes it the most critical trend line between the two.
Elliott also found that most of the times the price breaks the 1-3 trend line and retest the 2-4 one after breaking.
More about the Elliott Waves Theory and its implications in Forex trading will come later in our Trading Academy. For now, it is essential to understand how wedges form, how to trade them, and the fact that they are an integer part of many trading theories and concepts.
Conclusion
While the focus of this article sat with clear trading rules for wedges, keep in mind that they reverse trends. Check the EURUSD monthly chart from above and see that the price fell much lower after the take profit was met.
Because of that, traders use different approaches, depending on the trading style and expectations. Trailing stops is one way to deal with a trend reversal.
For example, how about booking half the profits at the take profit, and trailing the stop for the rest. How can we do that?
On the monthly time frame, or on any other more significant time frame as well (weekly, daily), trailing a stop doesn’t need software. Just move the stop loss at the end of the previous candle.
A simple rule like this one allowed to ride almost the entire bearish move on the EURUSD monthly chart.
This is not the last time we’ll discuss wedges in this project. As mentioned earlier, wedges are an integer part of the Elliott Waves Theory, and there is much more left to consider.
However, the basics of trading a wedge from a simple pattern recognition approach are enough for profitable trades. They offer a disciplined approach to trading and keep feelings and emotions out of the trading game.
After all, if all you must do is to wait for the trend line to break, set the stop loss and the take profit, what can go wrong? No emotions, no nothing, just watch the market move.
Unfortunately, that’s easier said than done. Even the monthly EURUSD chart seems natural to trade if you look at it after the fact.
During the wedge formation, traders face a tough time. They need patience and discipline, as these are the most critical traits for being successful in Forex trading.