

Basics of Elliott Waves Theory
Charting or technical analysis is made of a set of tools that help traders building a forecast. Today’s Forex trading gives the opportunity to apply old and new concepts when charting a currency pair, most of them already built into the trading platform.
Any platform offers technical indicators (oscillators, trend indicators) and other technical tools that traders use to chart a currency pair. On top of the inbuilt tools, traders use trading theories to analyze the way a currency pair has evolved with time.
The Elliott Waves Theory stands out as one of the most powerful forecasting theories. Developed by Ralph N. Elliott at the start of 1900’s, the Elliott theory looks at market cycles and interprets them via a logical process.
The beauty of it is that it addresses human behavior. Elliott built it under the assumption that the market moves for a reason, and that reason is not the result of supply and demand, but the result of human behavior.
No other theory incorporates the human sentiment the way the Elliott theory does. For this reason, it offers an unparalleled approach to trading.
We all know trading performance depends on more than a profitable strategy. Market psychology, greed, and fear, patience, and discipline…they all contribute to the success in Forex trading.
Ralph N. Elliott claimed to have found a solution that catches the market sentiment in a manner never seen before. Fast forward three-quarters of a century and the Elliott Waves Theory remains the one theory to treat market psychology in a disciplined way.
As an accountant, Elliott fell ill and was forced to rest for a while. He used that time to study the stock market and documented all the patterns he discovered.
From that moment on, he never stopped working on building one of the greatest trading theories in existence. Towards the end of his life, Elliott claimed to have discovered “the secret of the universe,” when he published the final version of his theory.
Explaining the Elliott Waves Theory
Based on a set of clear rules, the theory appears simplistic at first look. According to Elliott, investors sentiment shifts between pessimism and optimism.
In doing so, the market forms waves or patterns that are the pillars of the Elliott theory. The waves form a cycle and, to analyze a market correctly, traders must interpret various cycles of different degrees.
A cycle has two phases: an impulsive and a corrective one. The impulsive wave is an advance or decline that the market makes in five sequences or waves of a lower degree.
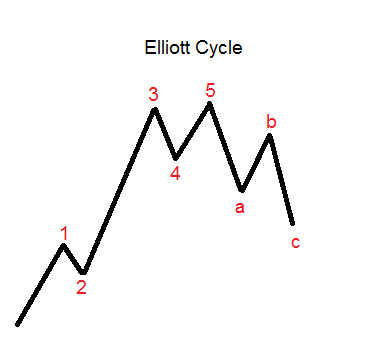
The corrective wave has a three-wave sequence of a lower degree and corrects the previous advance or decline. Here’s how an Elliott cycle looks like:

Pretty simple, isn’t it? The advance is impulsive, while the decline is corrective. Therefore, two phases to make up a cycle.
Elliott’s obsession was to simplify things as much as possible. Because he encountered so many patterns, he needed to set clear rules to define them all.
The first task was to divide a cycle into impulsive and corrective waves. Next, he used numbers to illustrate the impulsive activity, and letters to show corrective price action.
This is the reason why traders that use the Elliott theory say they “count” waves. Finally, a complete cycle looks like a sequence of numbers and letters, just like the one below.
Labeling waves was a breakthrough in Elliott’s work. From this moment on, every time you see an Elliott Waves analysis, you should know if the market shows impulsive or corrective conditions, by merely looking if most of the labeling has numbers or letters.
Because Forex trading shows mostly consolidation areas, the chances are corrective waves will form most. But more on that later in the Trading Academy, when we’ll cover complex concepts within the Elliott Waves Theory.
So far, nothing seems to predict the complexity of the Elliott Waves Theory. What can be so difficult than to label the price moves?
It is precisely in its simplicity that leads to complex problems. Elliott found that even an impulsive wave has two corrections (waves 2 and 4).
And, even a corrective phase may show impulsive activity, as part of a wave of a lower degree, or a different cycle. The Elliott cycle showed earlier, may merely reflect the first and the second waves of an impulsive wave of a bigger degree.
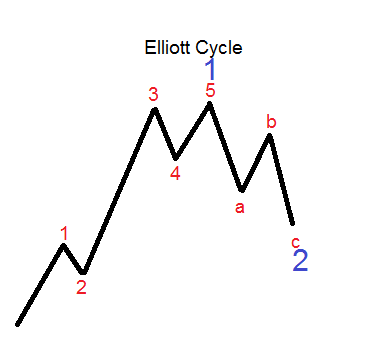
The two colors show different cycles. Therefore, the first wave in blue has a five-wave structure of a lower degree (red), that belongs to a different cycle.
And, the second wave in blue comprises the three-wave move that corrects the previous impulsive wave. To complicate things even further, the same principle applies to each cycle’s segment:
- Wave 1 red has a five-wave structure of a lower degree
- Wave 2 red corrects the previous wave 1
- Wave 3 red has a five-wave structure of a lower degree
- Wave 4 red corrects wave 3
- Wave 5 red is a five-wave structure that completes the impulsive wave
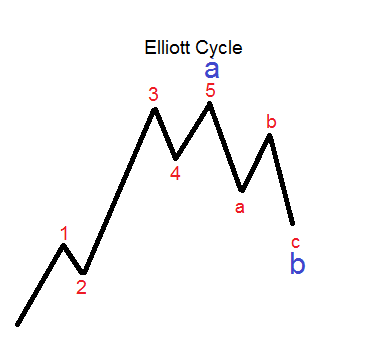
- Waves a, b and c in red correct the entire impulsive wave
The entire cycle could easily be waves a and b to a bigger degree, just like shown below:
Elliott identified various cycles of different degrees, and his work must have been gigantic because in those times personal computers didn’t exist. Nowadays, any Forex trading platform offers different timeframes to analyze a currency pair.
Therefore, traders identify bigger cycles easier by analyzing different cycles. In a process called top/down analysis, traders start from the bigger timeframe (monthly chart) and label the waves all the way down to the hourly chart.
They continue on the weekly timeframe where left on monthly, on daily from where the weekly analysis ended, and so on. In the end, the Elliott Waves Theory “maps” the entire moves of a currency pair, and the result is a forecast for the period ahead.
From a pure concept like splitting the waves into impulsive and corrective, the theory moves to rules for each pattern. Elliott found no less than three types of impulsive waves and multiple kinds of corrections, from simple to complex.
We’ll cover everything in the course of this Trading Academy, but for now, it is enough to understand the basis of this beautiful theory.
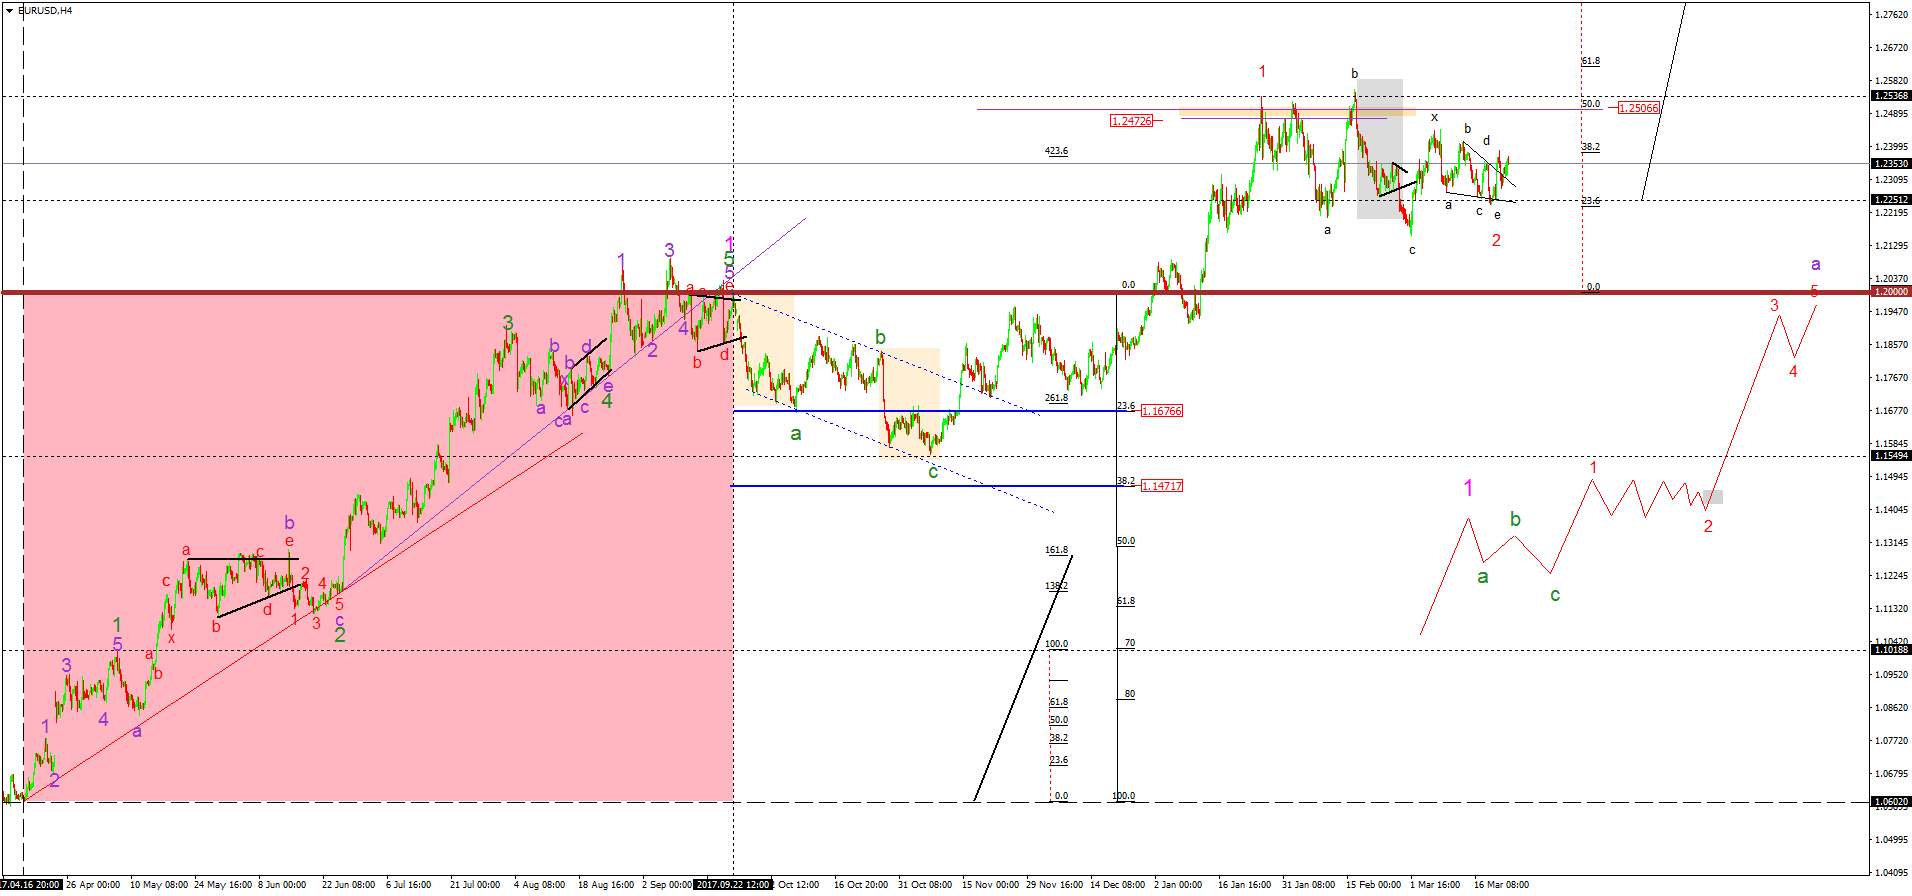
In the end, complex counts may end up looking like the one below. For the moment, all you must know from that chart is about numbers and letters from an Elliott count, with numbers showing impulsive activity and letters depicting a correction.
Conclusion
Despite its complexity, the Elliott Waves Theory has many followers. Counting waves is a time-consuming process, and a proper top/down analysis can take weeks to finish.
In Forex trading, the main problem comes from an unexpected source: data availability. If you open any trading platform and pick a main currency pair, like the GBPUSD, for example, you’ll find out it only has data since the 1990’s.
However, we do know both GBP and USD existed before. Therefore, for a proper top/down analysis using the Elliott Waves theory, traders must find historical data and interpret it before using the timeframes in the trading platform.
While the Elliott Waves Theory is a concept developed so many years ago, before Forex trading even existed, its principles work on the currency market. Because it is based on the way humans react, the theory can track any market, if there is historical data to analyze.
Further into the Trading Academy, we’ll look at the Elliott theory in details, covering its most important aspects. For now, keep in mind the method is one of the best ways to interpret a market, but few people truly understand the power of it.