

Understanding Japanese Candlesticks: The Hammer
Technical analysis as we know it is a mix of the Western and Japanese approach. It all started with the stock market in the United States, when traders documented patterns well-known to the technical world, like the head and shoulders, double and triple top, wedges, etc.
Few knew that in Japan, long before the United States stock market even existed, the Japanese used candlesticks to predict future prices on the rice market. Fast forward a few hundred years, the Japanese candlesticks techniques are part of today’s technical analysis and have a special place in Forex trading.
Mostly reversal patterns, the candlesticks patterns amaze through their simplicity and effectiveness. Their most powerful feature comes from the way they integrate a trade into a money management system.
A candle chart analysis starts with understanding the concept of a candlestick: a real body given by the opening and closing prices, and the upper and lower shadows (highest and lowest points in a candle).
Savvy traders looking for risk-reward ratios that make sense in Forex trading (1:2 or 1:2.5), turned their attention to the candlestick patterns and for a good reason. They take less time to complete than the traditional, classic patterns mentioned earlier, and therefore offer more opportunities to trade.
For this reason, traders around the world embraced them wholeheartedly. Today, a candlestick chart is the first option when looking at a market, making the Japanese candlestick techniques a must-know part of technical analysis.
The Hammer in Forex Trading
A one-candle reversal pattern, the hammer shows a battle between bears and bulls. In fact, all reversal patterns prove just that, but the conflict between the two parties is better seen with the Japanese candlesticks techniques.
For a hammer to exist, a bearish trend needs to be in place. Bears are in control, and the general sentiment is that the market will just keep falling.
Bulls look for an opportunity or a sign that signals the bearish trend might end. The hammer is the pattern that shows that.
Before going into more details about the hammer, like what the conditions for it are and how to trade it, we must define a candlestick. Unlike the bar chart, that shows only the opening and closing prices of a period, the candlestick chart indicates the nature of the candles too.
Typically, the green and red colors are used by traders to signal prices that rise and fall. Hence, the default interpretation means a bullish trend has mostly green candles, while in a bearish one, the red candles predominate.
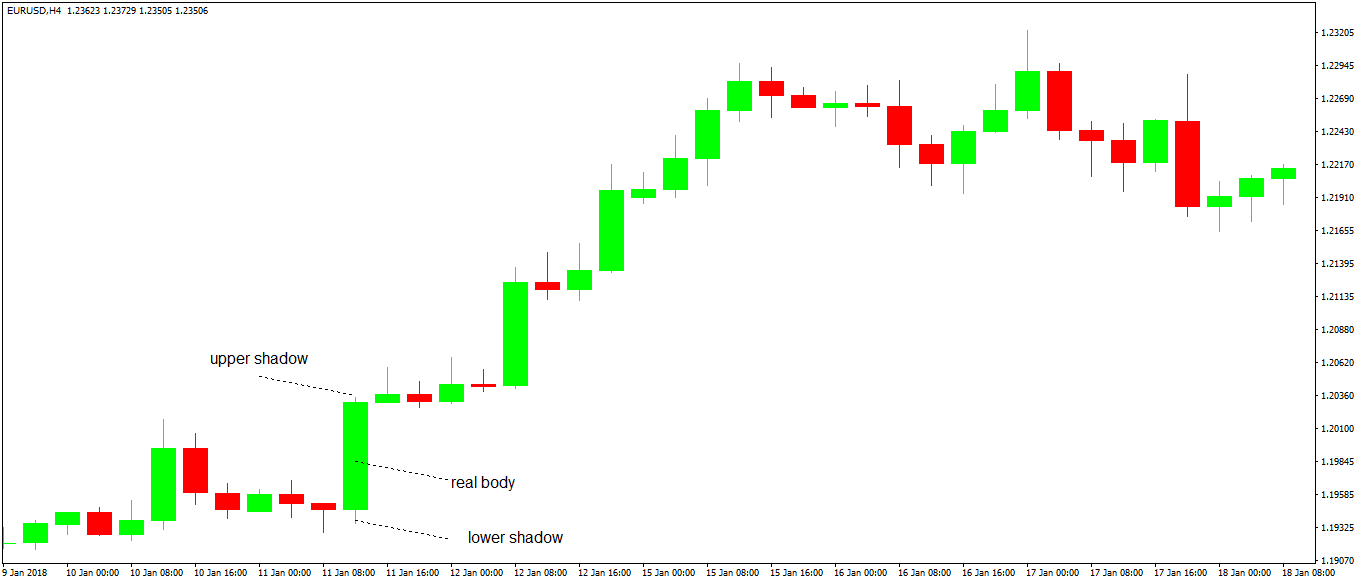
Any candlestick has a so-called real body, that shows the difference between the opening and closing prices for that candle. When the closing price exceeds the opening, the candles are bullish, or green. If not, the candle is red, or bearish.
A candle with similar opening and closing prices is a Doji candle. It is a unique candle, and we’ll treat it in a separate article on this Trading Academy.
Candlesticks also have shadows, showing the absolute high or low in a period. A shadow’s length tells much about the price action in that particular candlestick, leading to various patterns.
As mentioned earlier, the hammer is a one candle pattern, a bullish one, that forms at the end of a bearish trend. Therefore, it is impossible to find a hammer at the end of a bullish trend.
However, the concept exists, just that it has a different name: the shooting star. Everything discussed in this article that belongs to the hammer concept, applies to the shooting star too, with the exception that the later is bearish, not bullish.
Conditions for the Hammer Pattern
A hammer has a tiny real body, that is either green or red. The nature of it has no significance in the hammer’s interpretation.
The most important aspect of a hammer is the shadow. More precisely, the lower shadow.
It needs to be longer than two times the body’s length. This is the minimum condition for a bottoming candle to be a hammer.
Powerful hammer candles have a very long lower shadow, and the importance of the hammer pattern increases with the timeframe it appears on. For example, a hammer on the daily chart has more bullish implications than one on the hourly timeframe.
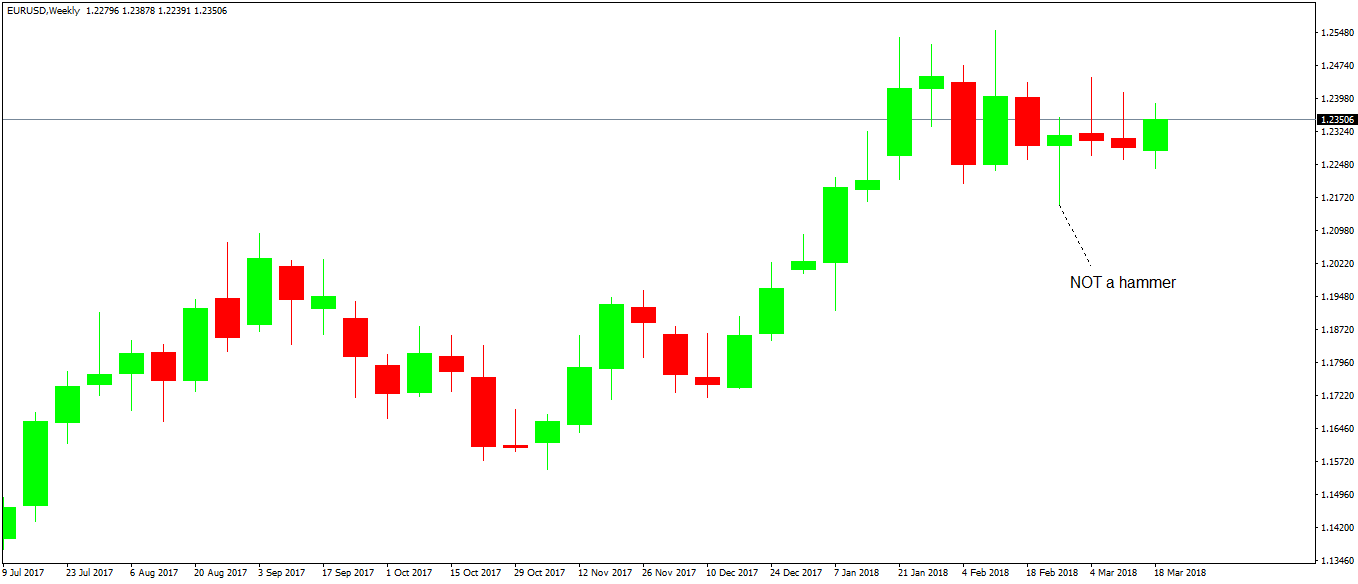
The first thing to know about a hammer is that it forms after a bearish trend. While a candle like the one on the weekly EURUSD chart looks like a hammer, it isn’t!
Just because there is no bearish trend, is enough to discount the candle. This is how a hammer looks like:
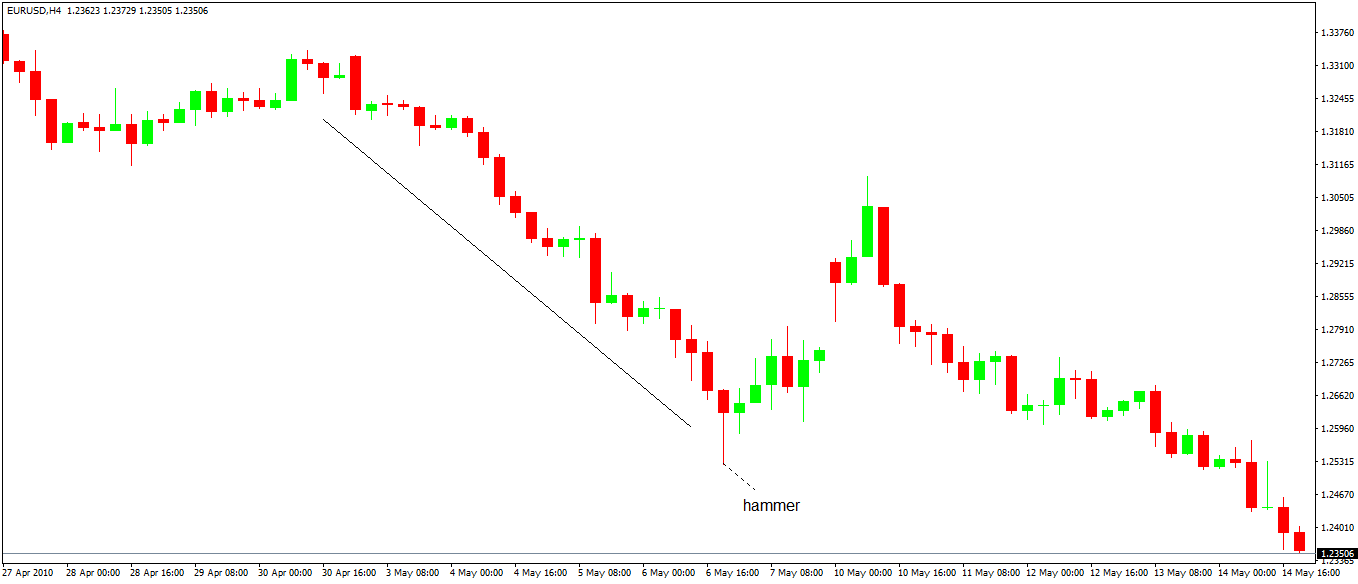
The bearish trend is evident. Bears are in control and bulls look for an opportunity to get in.
The chart above is perfect to illustrate the hammer pattern. While a reversal pattern, it doesn’t mean the bears will give up without a fight.
In the end, the hammer failed to reverse the entire trend, but it did cause a spike higher. After that, the bearish trend resumes, and the market invalidates the reversal pattern by the time it breaks below the hammer’s absolute low.
Trading the Hammer Pattern
All Japanese candlesticks patterns offer great risk-reward ratios. In Forex trading, anything between 1:2 and 1:3 is enough for a robust money management system.
It means the reward must exceed the risk by a ratio of two or three. Hence, even if some trades will end up with a loss, a disciplined approach like this one leads to the account to grow in time.
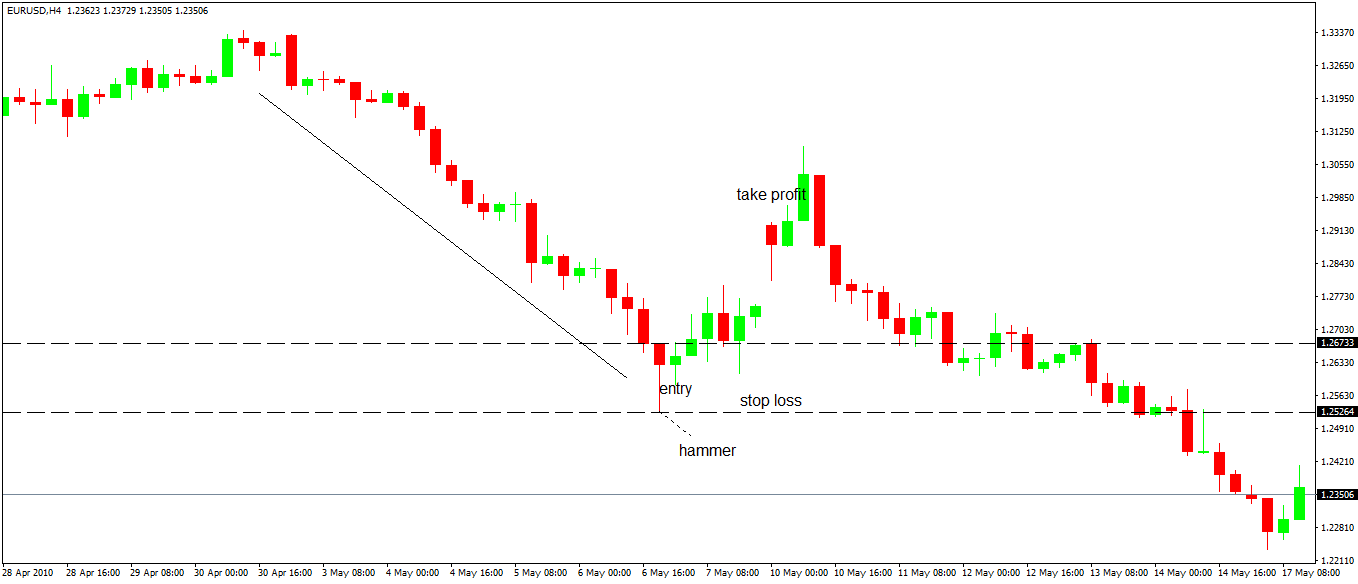
Coming back to the hammer pattern showed earlier, here’s how to trade it. Remember that the hammer shows a battle between bulls and bears?
It means that after the hammer formation, wait for a pullback before going long. Savvy traders use the Fibonacci retracement tool and measure the length of the hammer.
Next, they pick the 50% and 61.8% retracement levels as the entry points for the long trade. Finally, they place the stop loss at the lowest point in the hammer candle.
That’s the absolute invalidation. If the price manages to break lower, the market invalidates the hammer.
As for the take profit, just measure the risk involved (the distance between the entry price and the stop loss) and multiply it by a factor of two or three. It is enough for a great trade, even though the bearish trend resumed eventually.
The hammer above formed on the four-hour chart, but the principle and way of trading the pattern remains the same on any timeframe. Naturally, a pattern on the monthly chart results in a bigger distance for the stop loss and the take profit, but the principles/rules to trade it are the same.
As the opposite of a hammer, a shooting star shows bearish conditions. Traders go short after the star formation, placing a stop loss at the top and setting the appropriate risk-reward ratio.
Conclusion
For a single candle, the hammer is an impressive reversal pattern. It signals a potential reversal, but it doesn’t guarantee one.
The trading approach described here showed the hammer’s ability to generate trades that respect a risk-reward ratio needed in a risk management system suitable to Forex trading. But that’s just a ratio and a target for the hammer, not for the entire move that follows it.
For this reason, aggressive traders don’t settle only with the target generated by the pattern. They book half of the profits at the indicated target, only to trail the stop loss for the rest.
This way, traders make the most of the reversal pattern. In the example used here, the aggressive approach didn’t work, as the bearish trend resumed.
However, the hammer generated profits even for an aggressive approach. It illustrates the ability of the hammer to give extraordinary trading opportunities!