

Why CCI Standard Interpretation Fails
The CCI (Commodity Channel Index) oscillator is popular in Forex trading. Traders love it because it shows both continuation and reversal patterns.
Relatively new on the technical analysis field, the CCI was introduced by Donald Lambert in 1980 to analyze the commodity markets. However, today it is successfully used by traders in all markets, from stocks to Forex trading.
The oscillator travels both in the positive and negative territory, the standard interpretation showing overbought and oversold levels. Like in the case of other oscillators too, the standard definition calls for shorting the market in overbought territory and going long in the oversold area.
However, while it may work with other oscillators, the standard interpretation mostly fails with the CCI. The problem comes from the way it is built, as it measures the price’s variation from a statistical mean.
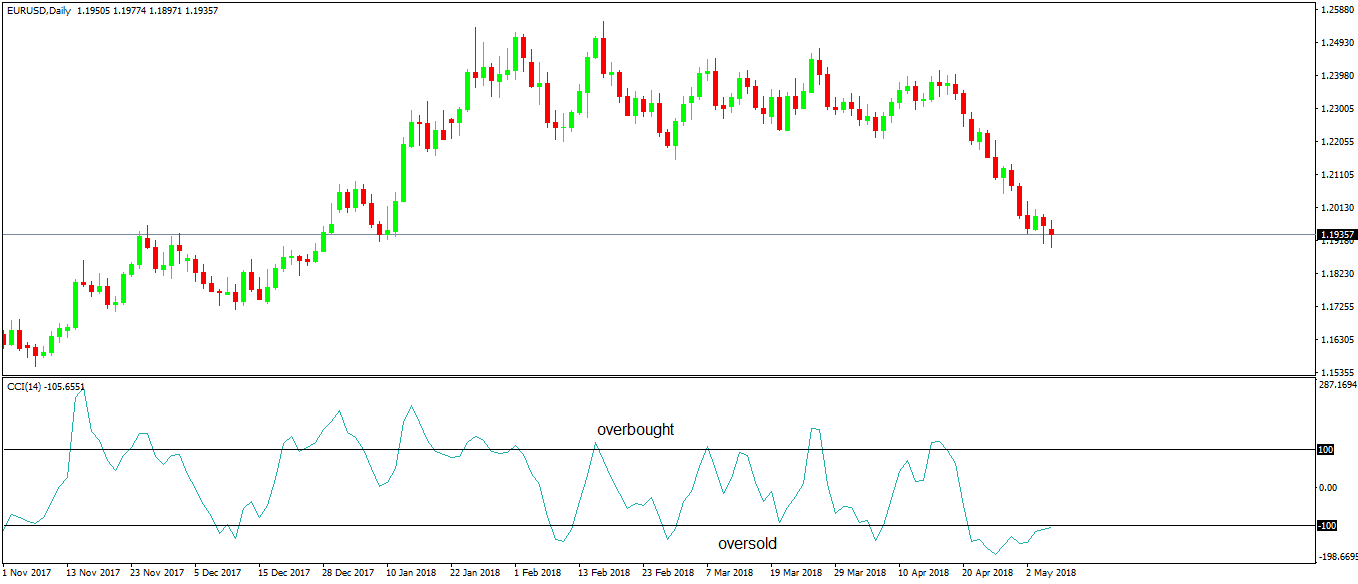
Values over 100 show overbought territory and below -100 oversold territory. But as the EURUSD daily chart from above shows, the oscillator may stay in the overbought or oversold area for quite some time before a meaningful retracement.
Therefore, instead of using the CCI as a classic oscillator, how about looking for new ways to trade with it? This article aims to show how to best use the CCI in Forex trading, presenting three different ways to use the CCI, other than the standard interpretation:
- CCI as a continuation pattern with the zero level
- divergences with the CCI
- true overbought and oversold areas with the CCI
Trading CCI with the Zero Level
For this approach, we need to alter the oscillator a bit. More precisely, take a horizontal line and place it over the zero level, so it becomes visible on the oscillator’s window.
To do that using the MetaTrader4 platform, just right-click on the chart, select the Indicators List, and edit the CCI by adding the zero level.
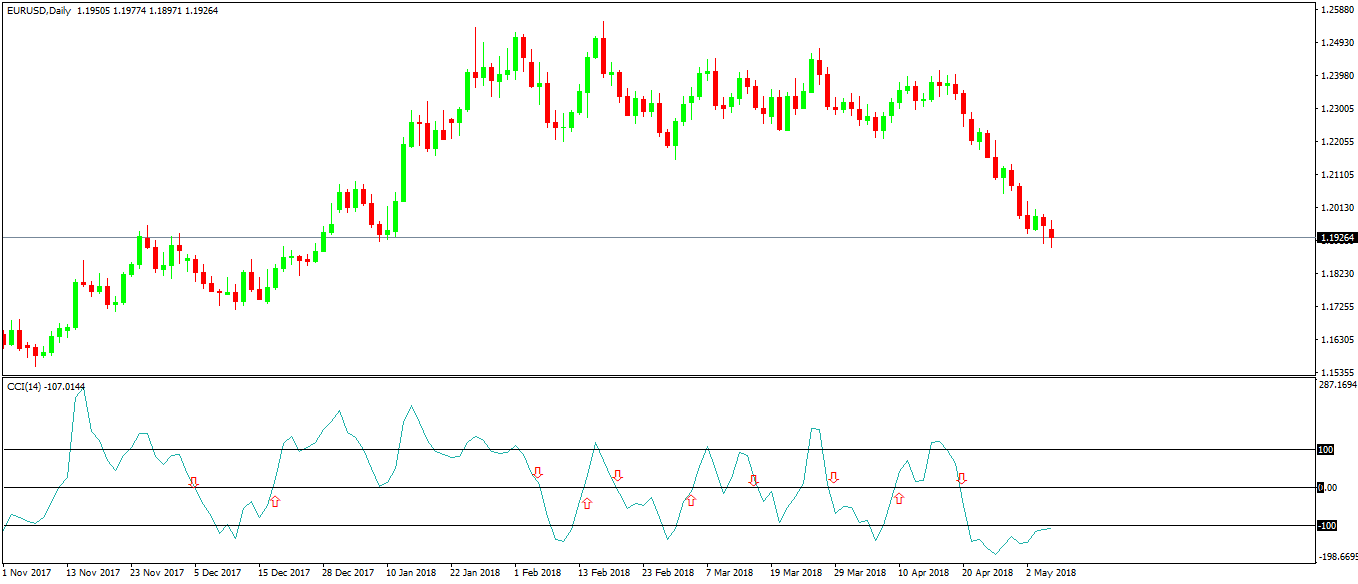
To make the entries visible, the red arrows show the moments the CCI crosses the zero level. However, merely going long or short at such signals doesn’t guarantee to catch the primary trend.
Hence, we need to define a set of rules for trading with the zero level, rules that have the entry, stop loss and take profit level.
The entry long or short is clear: when the CCI crosses the zero level. But the outcome differs if the market is in a range or trending. Since traders can’t know ahead what the cross will bring, the key is to stay in the trade until the CCI reaches above 100 or below -100 and stays there.
As for the stop loss, because the strategy is a continuation one, it is mandatory to place the stop loss right at the top or at the bottom of the entry candle, depending if the trade is short or long.
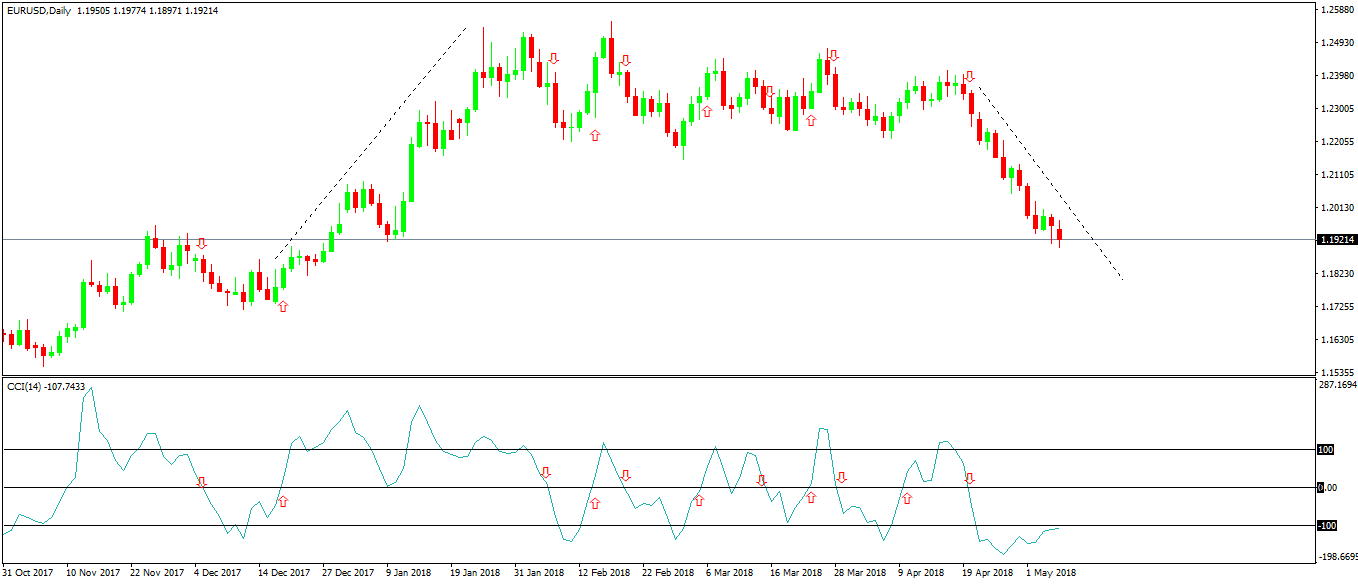
Following the rules listed above and applying them on the previous daily EURUSD timeframe, shows why the CCI is a great trend indicator. The zero-level cross, while punishing traders when the market is in a range, will position the trader on the right side of any market.
The approach was enough for traders to catch the two main trends on the pair this 2018: the bullish one from the start of the year and the current bearish one, with the target still open. When/if the CCI crosses above -100 traders will close the short trade.
It shows a disciplined approach to trading and the beauty is that the strategy works on every timeframe and every currency pair. We can say it suits Forex trading well because of precise entry and exit points.
Divergences with the CCI
We’ve covered divergences with another oscillator in this trading academy, but the CCI is a special one. Because it reaches the extreme levels (100 and -100) easy, even when the market is in a range, traders pay extra attention to divergences.
Before setting the rules to trade divergences with the CCI, let’s remember the conditions for a bullish and bearish divergence:
- the price makes two consecutive highs, but the oscillator fails to confirm the second one – a bearish divergence appears
- the price makes two lower lows, but the oscillator fails to make the second one – a bullish divergence forms
Trading divergences are very common in Forex trading, as it is human nature to try to pick tops and bottoms. Hence, divergences are favored by retail traders.
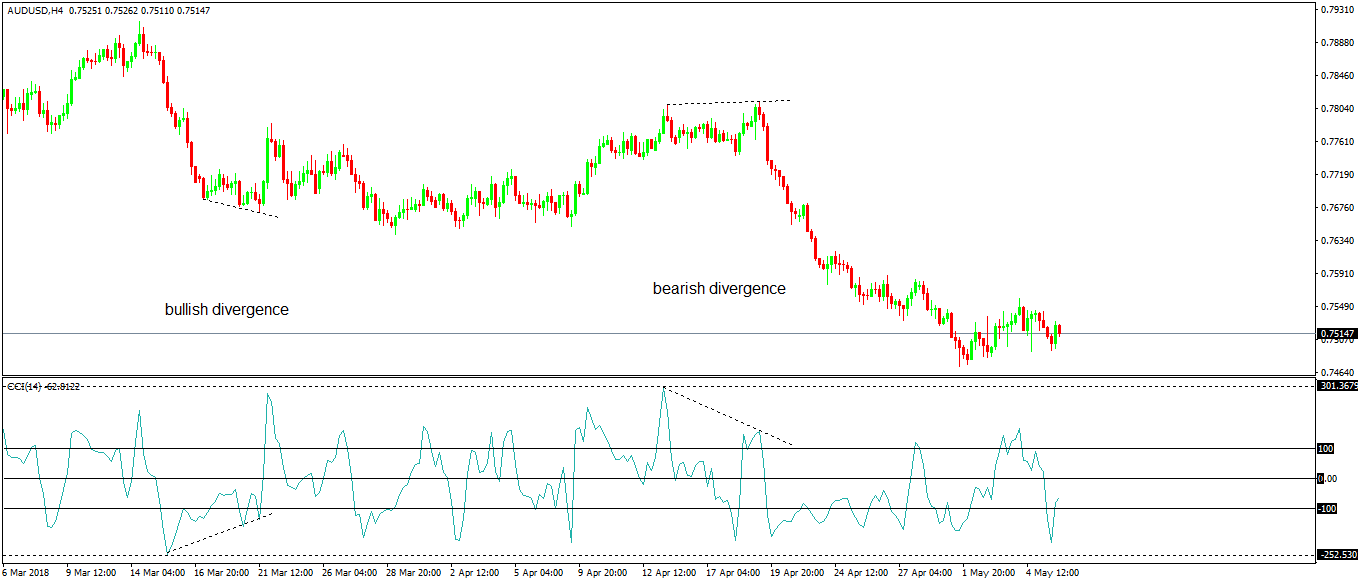
The AUDUSD four-hour timeframe shows a bullish and bearish divergence that the CCI forms with the price. They were enough to pick up the bottom and the top of the previous trends.
However, as always, there’s a catch. In this case, the secret is to focus on the first swing part of the divergence.
A correct divergence should have the first swing traveling way into the overbought or oversold territory. More precisely, way beyond the 100 or -100 level.
On the AUDUSD chart, the two horizontal lines show that the first swing on the bearish divergence had a corresponding CCI value of -250, while the first one of the bearish divergences showed a value of about 300. This is enough for traders to consider the divergences. Consequently, lower CCI values would invalidate the setup.
True Overbought and Oversold Areas with CCI
Once again, we need to alter the oscillator. Because of its ability to reach 100 or -100 easily, even with the market holding a range, we need to re-define the overbought or oversold levels by adding new extremes.
Naturally, after we do that, the trading signals’ frequency will decline, but the accuracy increases instead. The levels chosen are 300 and -300, and the idea is to sell a move beyond the 300 and buy one below -300.
By applying the changes, you’ll find out that the price has a difficult time now to reach the levels. However, we can use the setup on every timeframe and any currency pair. Because Forex trading gives us the possibility to trade multiple currency pairs and even different markets, the strategy offers plenty of occasions to pick up a top or a bottom.
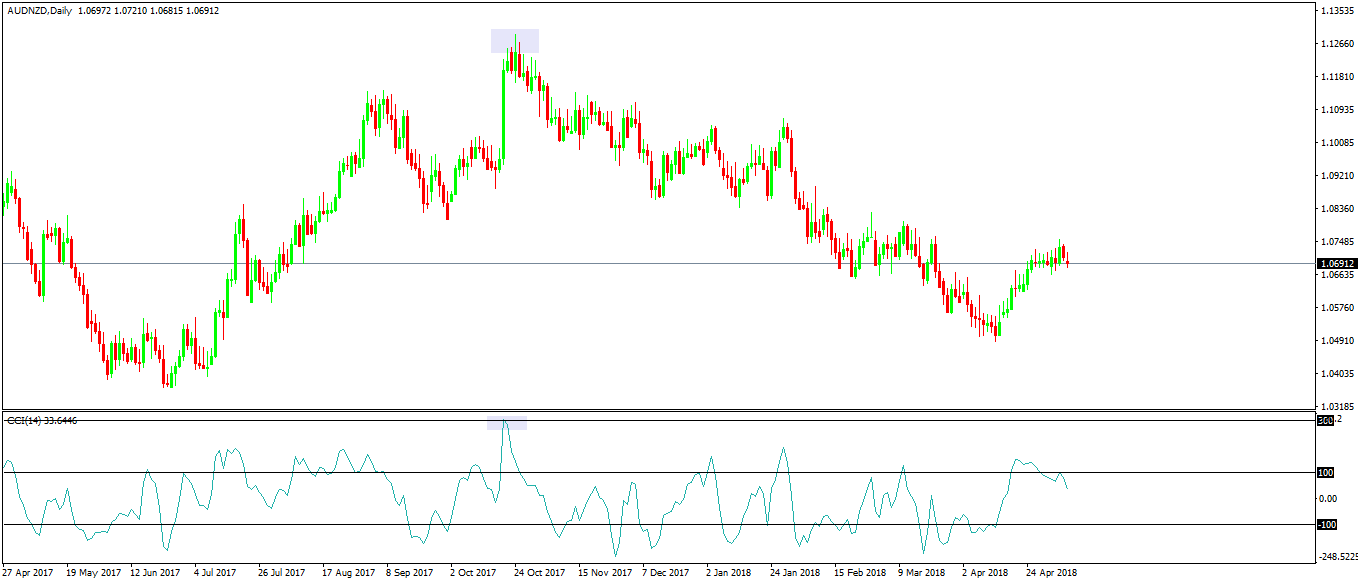
The chart above shows the AUDNZD daily time frame. The spike higher above 1.12 a few months ago corresponded with the CCI printing a value over 300.
Naturally, according to the setup this is overbought area and going short ends up picking the top of the move.
Not every setup goes smoothly though. For this reason, just make sure you have a stop loss in place.
The steps to trade this setup are:
- wait for the CCI to print above or below 300/-300
- go short/long only after the CCI moves back between 100 and -100
- place a stop loss at the recent swing higher/lower
- target a risk-reward ratio of a minimum 1:3
- or trail the stop in such a way to profit from the new trend as much as possible
Conclusion
Despite being a relatively old technical indicator and built for different markets, with a bit of imagination the CCI gives plenty of opportunities in Forex trading too.
This article showed three different ways to use it while ignoring the standard interpretation as it is prone to error.
As always, no trading setup is worth anything unless it is part of a sound money management setup. More about how to build one, in the articles to follow in this trading academy.